(Part I) Integration, cross-atlas comparison, and transfer learning
Contents
(Part I) Integration, cross-atlas comparison, and transfer learning
This notebook contains codes for integration, cross-atlas comparison, and transfer learning using scAtlasVAE.
Please check the package version at https://github.com/WanluLiuLab/scAtlasVAE/blob/master/environment.yml for reproducing the results.
For more information about the scAtlasVAE model, please see https://scatlasvae.readthedocs.io/en/latest/.
For retrieving datasets, please see https://zenodo.org/records/10472914.
Installing scAtlasVAE
in bash, run pip install scatlasvae
Please run the following code block for importing packages
import scatlasvae

# import packages
import scanpy as sc # import scanpy
import matplotlib
import matplotlib.pyplot as plt # import matplotlib
import numpy as np # import numpy
import pandas as pd # import pandas
import gc # import garbage collector
from typing import Literal, Union # import typing

# set plot linewidth
def setPltLinewidth(linewidth:float): # define function to set plot linewidth
    matplotlib.rcParams['axes.linewidth'] = linewidth # set plot linewidth
setPltLinewidth(1) # set plot linewidth to 1

# set plot parameters
plt.rcParams['figure.dpi'] = 300 # s get figure resolution
plt.rcParams['savefig.dpi'] = 300 # set figure resolution
plt.rcParams['font.size'] = 8 # set font size
plt.rcParams['axes.linewidth'] = 1 # set plot linewidth
plt.rcParams['font.family'] = "Arial" # set font family
# Useful functions

try:
    import seaborn as sns
    import matplotlib
    import matplotlib.pyplot as plt

    matplotlib.rcParams["font.family"] = "Arial"
    matplotlib.rcParams["font.size"] = "10"
    matplotlib.rcParams["font.weight"] = 100
    matplotlib.rcParams["axes.linewidth"] = 2
    matplotlib.rcParams["axes.edgecolor"] = "#000000"

    def createFig(figsize=(8, 4)):
        fig, ax = plt.subplots()
        ax.spines["right"].set_color("none")
        ax.spines["top"].set_color("none")
        # ax.spines['bottom'].set_color('none')
        # ax.spines['left'].set_color('none')
        for line in ax.yaxis.get_ticklines():
            line.set_markersize(5)
            line.set_color("#585958")
            line.set_markeredgewidth(0.5)
        for line in ax.xaxis.get_ticklines():
            line.set_markersize(5)
            line.set_markeredgewidth(0.5)
            line.set_color("#585958")
        ax.set_xbound(0, 10)
        ax.set_ybound(0, 10)
        fig.set_size_inches(figsize)
        return fig, ax

    def createSubplots(nrow, ncol, figsize=(8, 8), gridspec_kw={}):
        fig, axes = plt.subplots(nrow, ncol, gridspec_kw=gridspec_kw)
        for ax in axes.flatten():
            ax.spines["right"].set_color("none")
            ax.spines["top"].set_color("none")
            for line in ax.yaxis.get_ticklines():
                line.set_markersize(5)
                line.set_color("#585958")
                line.set_markeredgewidth(0.5)
            for line in ax.xaxis.get_ticklines():
                line.set_markersize(5)
                line.set_markeredgewidth(0.5)
                line.set_color("#585958")
        fig.set_size_inches(figsize)
        return fig, axes

    hist_kws = {"linewidth": 0, "alpha": 0.5}
except:
    print("failed to load plotting packages")

from collections import Counter


def plot_a_by_b(adata, a, b):
    B = pd.DataFrame(
        list(
            adata.obs[list(map(lambda x: type(x) == str, adata.obs[a]))]
            .groupby(b)
            .agg({a: lambda x: dict(Counter(x))})
            .iloc[:, 0]
        )
    ).fillna(0)
    B = pd.DataFrame((B.to_numpy().T / B.to_numpy().sum(1)).T, columns=B.columns)
    B.insert(0, b, pd.Categorical(adata.obs[b]).categories)
    ax = B.plot(
        x=b,
        kind="bar",
        stacked=True,
        color=sc.pl._tools.scatterplots._get_palette(adata, a),
    )
    return B, ax

def pandas_aggregation_to_wide(agg_df):
    return pd.DataFrame(agg_df.index.tolist(), columns=agg_df.index.names).join(
        pd.DataFrame(agg_df.to_numpy(), columns=agg_df.columns)
    )

from matplotlib.patches import PathPatch
def adjust_box_widths(g, fac):
    """
    Adjust the withs of a seaborn-generated boxplot.
    """

    # iterating through Axes instances
    for ax in g.axes:

        # iterating through axes artists:
        for c in ax.get_children():

            # searching for PathPatches
            if isinstance(c, PathPatch):
                # getting current width of box:
                p = c.get_path()
                verts = p.vertices
                verts_sub = verts[:-1]
                xmin = np.min(verts_sub[:, 0])
                xmax = np.max(verts_sub[:, 0])
                xmid = 0.5*(xmin+xmax)
                xhalf = 0.5*(xmax - xmin)

                # setting new width of box
                xmin_new = xmid-fac*xhalf
                xmax_new = xmid+fac*xhalf
                verts_sub[verts_sub[:, 0] == xmin, 0] = xmin_new
                verts_sub[verts_sub[:, 0] == xmax, 0] = xmax_new

                # setting new width of median line
                for l in ax.lines:
                    if np.all(l.get_xdata() == [xmin, xmax]):
                        l.set_xdata([xmin_new, xmax_new])
import scanpy as sc

default_10 = ['#1f77b4',
 '#ff7f0e',
 '#2ca02c',
 '#d62728',
 '#9467bd',
 '#8c564b',
 '#e377c2',
 '#7f7f7f',
 '#bcbd22',
 '#17becf']

zheng_2021_annotation_cmap_cd8 = {
    "CD8.c01.Tn.MAL": "#96C3D8",
    "CD8.c02.Tm.IL7R": "#5D9BBE",
    "CD8.c03.Tm.RPS12": "#F5B375",
    "CD8.c04.Tm.CD52": "#C0937E",
    "CD8.c05.Tem.CXCR5": "#67A59B",
    "CD8.c06.Tem.GZMK": "#A4D38E",
    "CD8.c07.Temra.CX3CR1": "#4A9D47",
    "CD8.c08.Tk.TYROBP": "#F19294",
    "CD8.c09.Tk.KIR2DL4": "#E45A5F",
    "CD8.c10.Trm.ZNF683": "#3477A9",
    "CD8.c11.Tex.PDCD1": "#BDA7CB",
    "CD8.c12.Tex.CXCL13": "#684797",
    "CD8.c13.Tex.myl12a": "#9983B7",
    "CD8.c14.Tex.TCF7": "#CD9A99",
    "CD8.c15.ISG.IFIT1": "#DD4B52",
    "CD8.c16.MAIT.SLC4A10": "#DA8F6F",
    "CD8.c17.Tm.NME1": "#F58135",
}

zheng_2021_annotation_cmap_cd4 = {
    "CD4.c01.Tn.TCF7": "#78AECB",
    "CD4.c02.Tn.PASK": "#639FB0",
    "CD4.c03.Tn.ADSL": "#98C7A5",
    "CD4.c04.Tn.il7r": "#83C180",
    "CD4.c05.Tm.TNF": "#B2A4A5",
    "CD4.c06.Tm.ANXA1": "#EC8D63",
    "CD4.c07.Tm.ANXA2": "#CFC397",
    "CD4.c08.Tm.CREM": "#F6B279",
    "CD4.c09.Tm.CCL5": "#6197B4",
    "CD4.c10.Tm.CAPG": "#CEA168",
    "CD4.c11.Tm.GZMA": "#A0A783",
    "CD4.c12.Tem.GZMK": "#9ACC90",
    "CD4.c13.Temra.CX3CR1": "#6A9A52",
    "CD4.c14.Th17.SLC4A10": "#E97679",
    "CD4.c15.Th17.IL23R": "#DE4247",
    "CD4.c16.Tfh.CXCR5": "#A38CBD",
    "CD4.c17.TfhTh1.CXCL13": "#795FA3",
    "CD4.c18.Treg.RTKN2": "#E0C880",
    "CD4.c19.Treg.S1PR1": "#C28B65",
    "CD4.c20.Treg.TNFRSF9": "#A65A34",
    "CD4.c21.Treg.OAS1": "#DE4B3F",
    "CD4.c22.ISG.IFIT1": "#DD9E82",
    "CD4.c23.Mix.NME1": "#E78B75",
    "CD4.c24.Mix.NME2": "#F7A96C",
    "undefined": "#FFFFFF",
}

zheng_2021_annotation_cmap = zheng_2021_annotation_cmap_cd8.copy()
zheng_2021_annotation_cmap.update(zheng_2021_annotation_cmap_cd4)

chu_annotation_string = """
CD8-3	CD8_c3_Tn	#E9ADC2
CD8-13	CD8_c13_Tn_TCF7	#AACC65
CD8-0	CD8_c0_Teff	#00AFCA
CD8-2	CD8_c2_Teff	#BBB7CB
CD8-8	CD8_c8_Teff_KLRG1	#E1A276
CD8-10	CD8_c10_Teff_CD244	#A5A2B3
CD8-11	CD8_c11_Teff_SEMA4A	#A3AFA9
CD8-6	CD8_c6_Tcm	#DD7A80
CD8-12	CD8_c12_Trm	#A4BD83
CD8-7	CD8_c7_Tpex	#EB9B7F
CD8-1	CD8_c1_Tex	#76BCD8
CD8-4	CD8_c4_Tstr	#E27C97
CD8-5	CD8_c5_Tisg	#DF6C87
CD8-9	CD8_c9_Tsen	#CCA891
CD4-2	CD4_c2_Tn	#E0C8D9
CD4-6	CD4_c6_Tn_FHIT	#F0A683
CD4-7	CD4_c7_Tn_TCEA3	#E5AE7C
CD4-9	CD4_c9_Tn_TCF7_SLC40A1	#A6AEBE
CD4-10	CD4_c10_Tn_LEF1_ANKRD55	#B3C28B
CD4-0	CD4_c0_Tcm	#4CBBD2
CD4-5	CD4_c5_CTL	#E9949E
CD4-1	CD4_c1_Treg	#9FC6DB
CD4-3	CD4_c3_TFH	#EFB3CC
CD4-8	CD4_c8_Th17	#C4ADA6
CD4-4	CD4_c4_Tstr	#EF9AB9
CD4-11	CD4_c11_Tisg	#C4D960
"""

subtype_color = {
    "Tn": "#CEBF8F",
    "Tcm": "#ffbb78",
    "Early Tcm/Tem": "#ff7f0e",
    "GZMK+ Tem": "#d62728",
    "GNLY+ Temra": "#8c564b",
    "CMC1+ Temra": "#e377c2",
    "ZNF683+ Teff": "#6f3e7c",
    "MAIT": "#17becf",
    "ILTCK": "#aec7e8",
    "ITGAE+ Trm": "#279e68",
    "CREM+ Trm": "#aa40fc",
    "ITGB2+ Trm": "#5ce041",
    "Tpex": "#ff9896",
    "GZMK+ Tex": "#C5B0D5",
    "ITGAE+ Tex": "#C3823E",
    "S100A11+ Tex": "#b5bd61",
    "MACF1+ T": "#3288c9",
    "Cycling T": "#f7b6d2",
}

subtype_color_alt = {"CD8+ " + k: v for k, v in subtype_color.items()}

chu_annotation = chu_annotation_string.split("\n")[1:-1]
chu_annotation = list(map(lambda x: x.split("\t"), chu_annotation))
import pandas as pd

chu_annotation = pd.DataFrame(chu_annotation)
chu_annotation_name = dict(zip(chu_annotation.iloc[:, 0], chu_annotation.iloc[:, 1]))
chu_annotation_cmap = dict(zip(chu_annotation.iloc[:, 1], chu_annotation.iloc[:, 2]))
chu_annotation_cmap_2 = dict(zip(chu_annotation.iloc[:, 0], chu_annotation.iloc[:, 2]))

default_20 = sc.pl.palettes.default_20
default_28 = sc.pl.palettes.default_28
godsnot_102 = sc.pl.palettes.godsnot_102
Initial integration of pan-disease CD8 atlas
adata_cd8 = sc.read_h5ad("./huARdb_v2_GEX.CD8.hvg4k.h5ad")
Note
For training scAtlasVAE model you will need CUDA available.
Please see the PyTorch official website for installing GPU-enabled version of PyTorch.
vae_model = scatlasvae.model.scAtlasVAE(
    adata=adata_cd8,
    batch_key="sample_name",
    additional_batch_keys=["study_name"],
    batch_embedding="embedding",
    batch_hidden_dim=64,
)
vae_model.fit(max_epoch=10, lr=5e-5)
adata_cd8.obsm["X_gex"] = vae_model.get_latent_embedding(show_progress=True)
sc.tl.paga(adata_cd8, groups='cell_subtype_3')
sc.pl.paga(adata_cd8, show=False)
sc.tl.umap(adata_cd8, init_pos='paga')
sc.pp.neighbors(
    adata_cd8, use_rep="X_gex", n_neighbors=40
)  # compute neighborhood graph
sc.tl.leiden(
    adata_cd8, resolution=1.2, key_added="leiden_n_neighbors_40_reoslution_1.2"
)  # compute leiden clustering
fig, ax = createFig(figsize=(4, 4))
sc.pl.umap(adata_cd8, color="leiden_n_neighbors_40_reoslution_1.2", ax=ax)
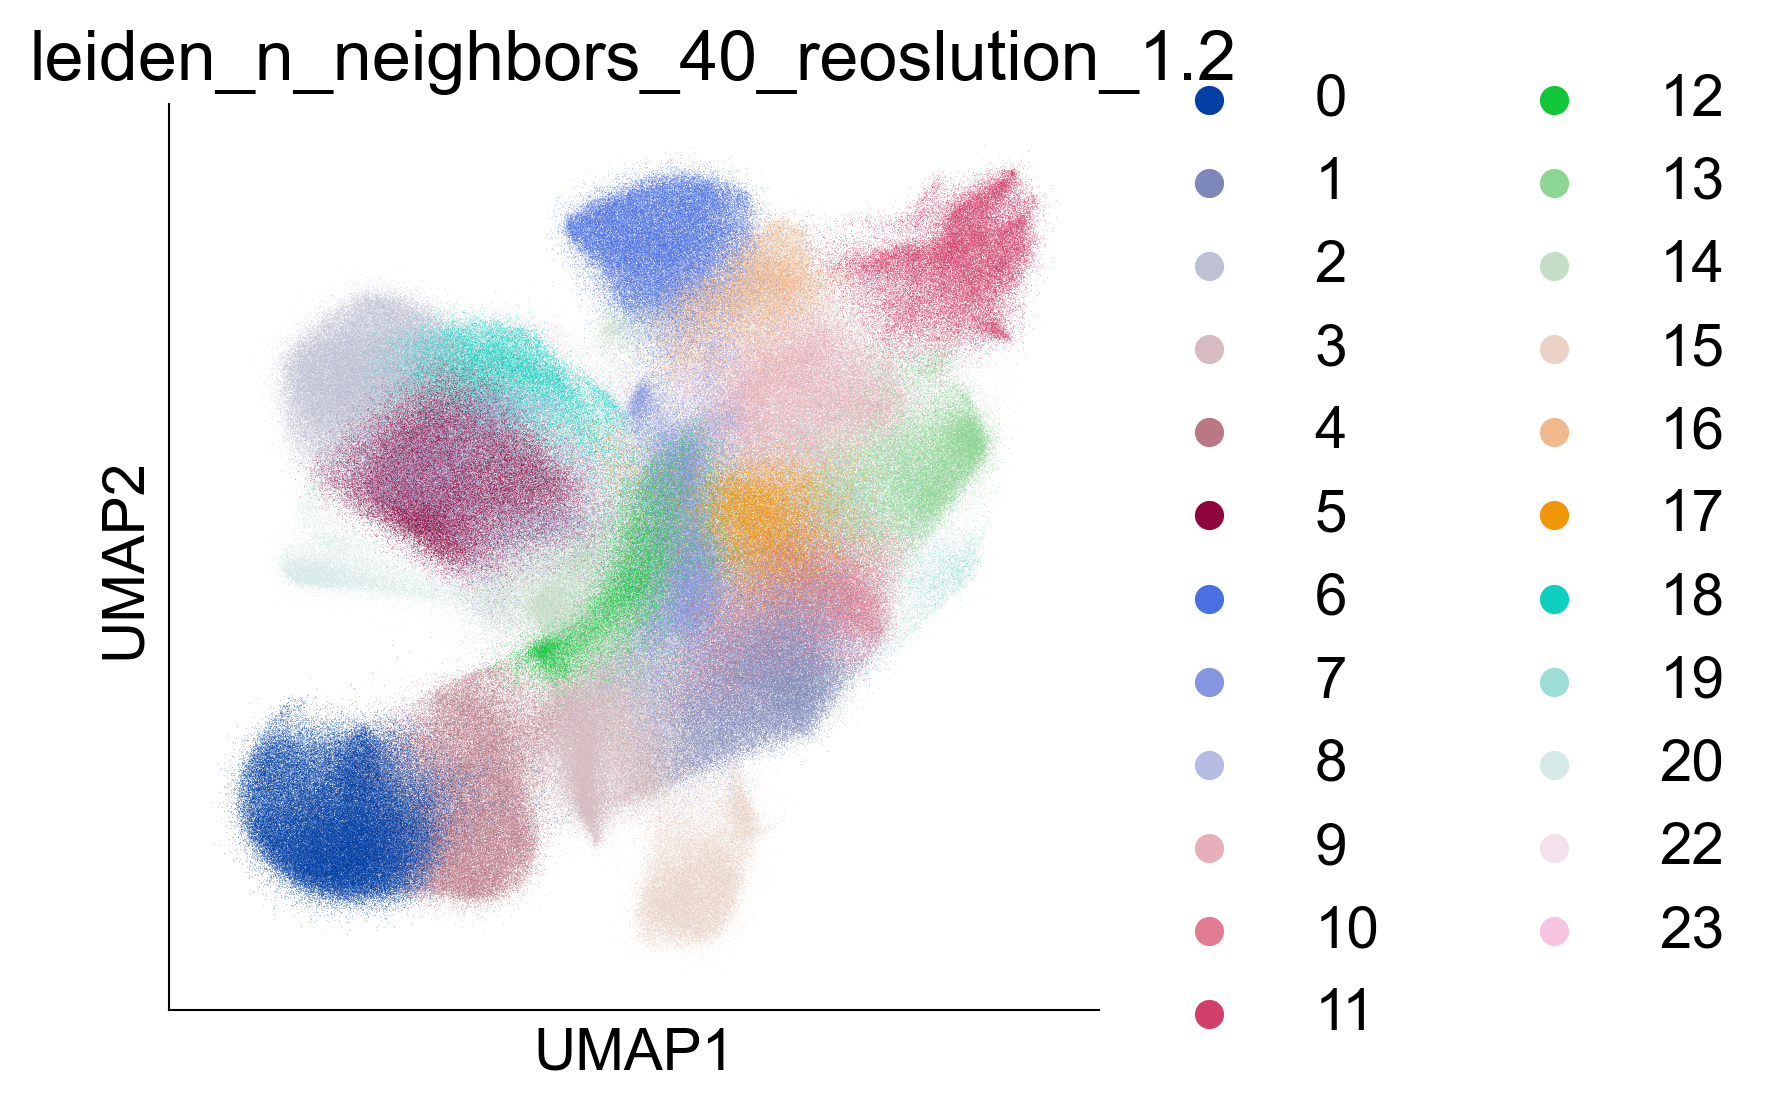
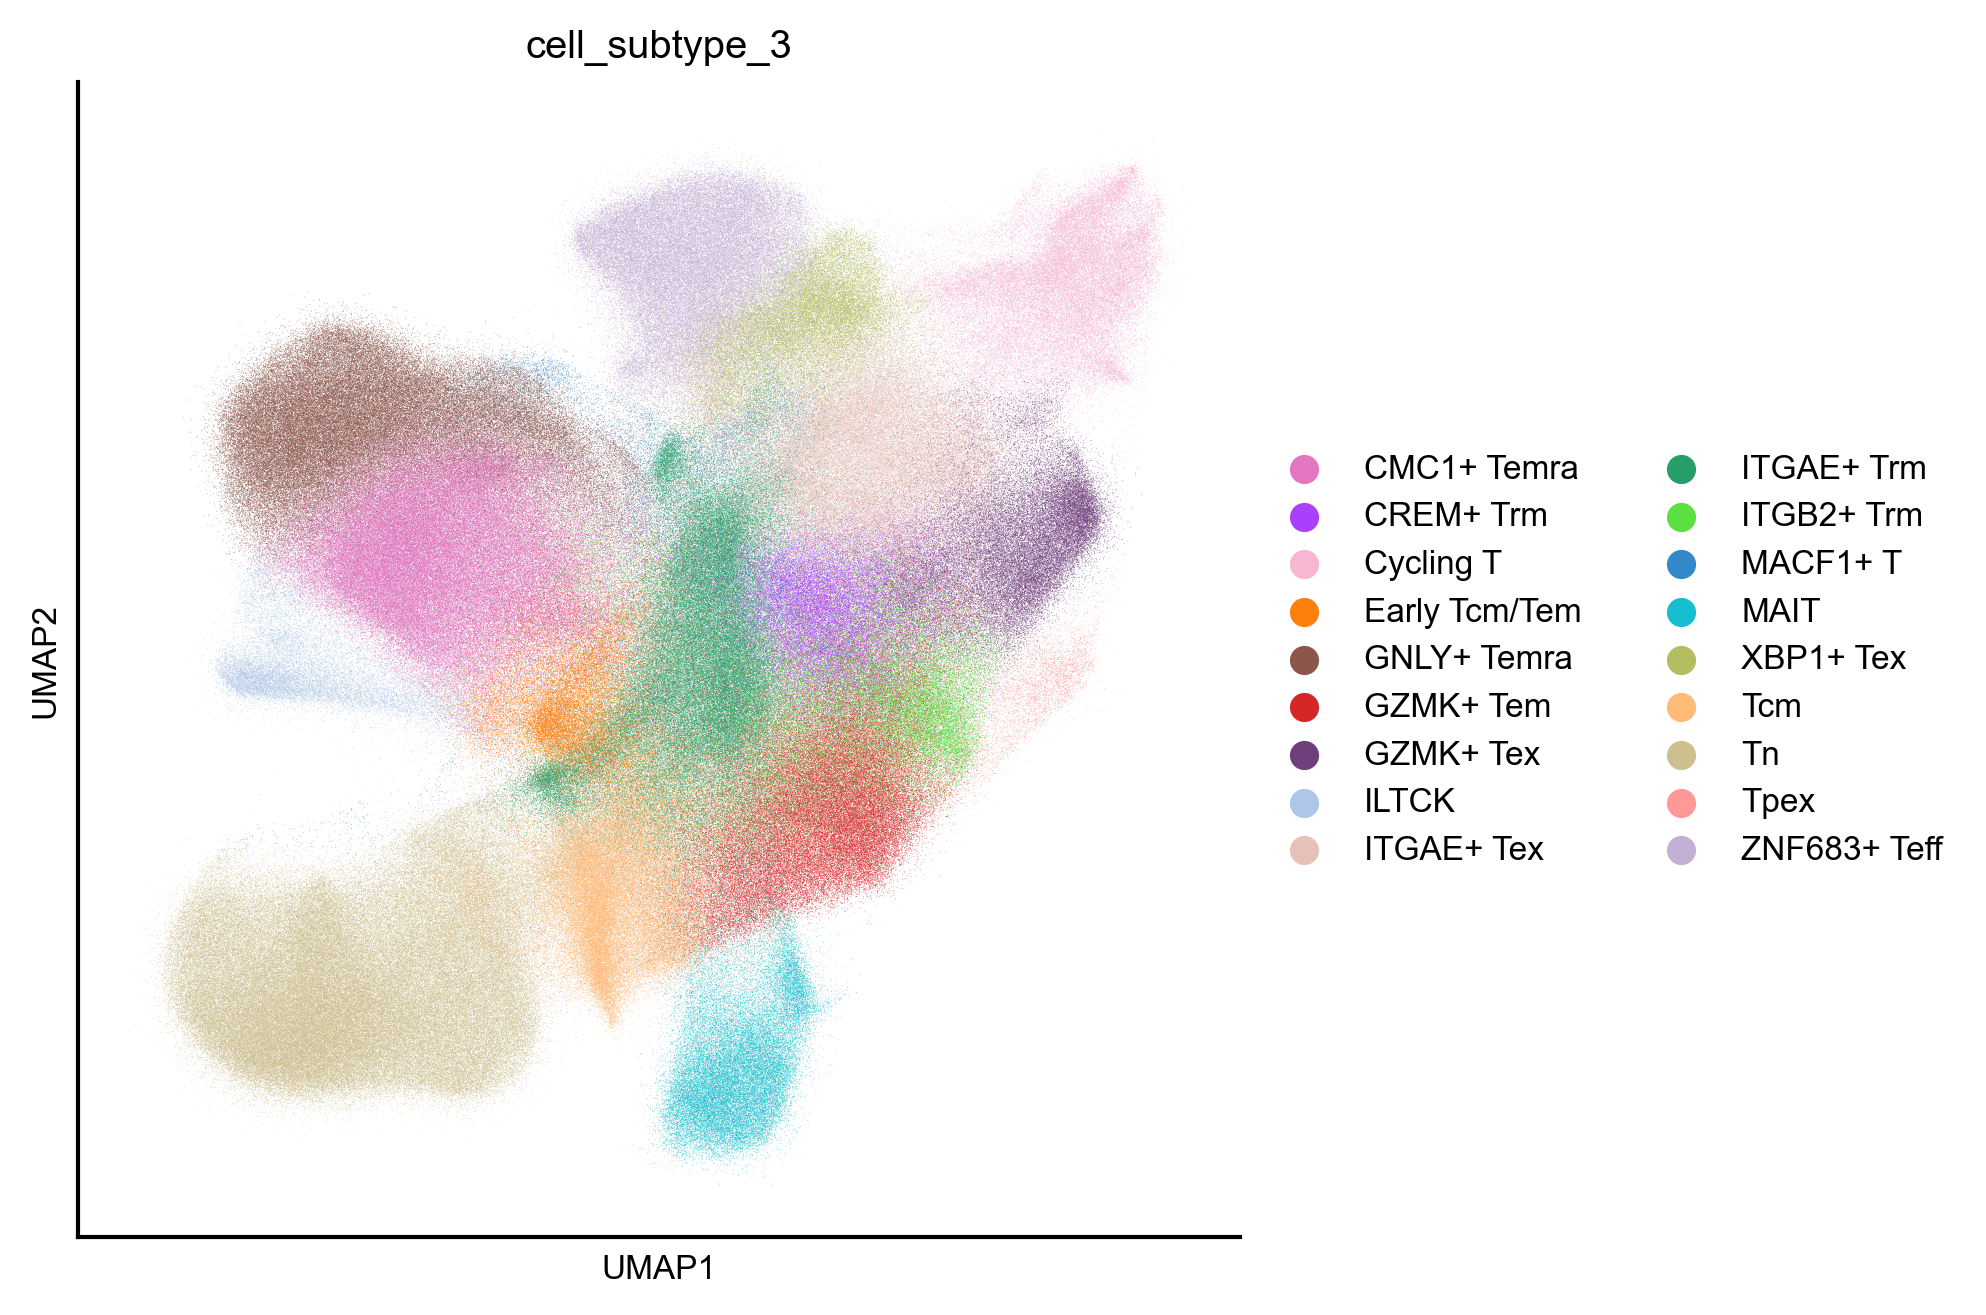
Figure 2A
Uniform manifold approximation and projection (UMAP) representation of 1,151,678 cells of the CD8+ T cell atlas, colored by 18 CD8+ T cell subtypes annotated in this study
fig, ax = createFig(figsize=(3, 3))
sc.pl.umap(adata_cd8, color="cell_subtype_3", ax=ax, palette=subtype_color)
Cross-atlas integration between pan-cancer and pan-disease CD8 atlas
adata_cd8_zheng_2021 = sc.read_h5ad("../data/adata_cd8_zheng_2021.h5ad")
adata_cd8_chu_2023 = sc.read_h5ad("../data/adata_cd8_chu_2023.h5ad")
Cross-atlas integration between pan-disease CD8 atlas and Zheng et al., 2021 TCellLandscape
Note
For training scAtlasVAE model you will need CUDA available.
Please see the PyTorch official website for installing GPU-enabled version of PyTorch.
adata_cd8_zheng_2021.obs['cell_subtype_3'] = 'undefined'
adata_cd8.obs['cell_subtype_zheng_2021'] = 'undefined'
adata_cd8.obs['atlas_name'] = 'huARdbv2'


adata_cd8_zheng_2021_merged = sc.concat([
    adata_cd8_zheng_2021, adata_cd8
], join='inner')

adata_cd8_zheng_2021_merged.obs['cell_subtype_3'] = list(adata_cd8_zheng_2021_merged.obs['cell_subtype_3'])
adata_cd8_zheng_2021_merged.obs['cell_subtype_3'] = adata_cd8_zheng_2021_merged.obs['cell_subtype_3'].fillna("undefined")

multi_atlas_vae_model = scatlasvae.model.scAtlasVAE(
    adata=adata_cd8_zheng_2021_merged,
    batch_key='sample_name',
    additional_batch_keys=['study_name','atlas_name'],
    batch_embedding='embedding',
    batch_hidden_dim=64,
    label_key='cell_subtype_3',
    additional_label_keys=['cell_subtype_zheng_2021'],
    device='cuda:2'
)
multi_atlas_vae_model.fit(
    max_epoch=32,
    lr=5e-5,
    kl_weight=1.,
    n_epochs_kl_warmup=16
)

import umap
adata_cd8_zheng_2021_merged.obsm['X_gex'] = multi_atlas_vae_model.get_latent_embedding()
adata_cd8_zheng_2021_merged.obsm['X_umap'] = umap.UMAP().fit_transform(adata_cd8_zheng_2021_merged.obsm['X_gex'])


predictions = multi_atlas_vae_model.predict_labels(return_pandas=True)
predictions_logits = multi_atlas_vae_model.predict_labels(return_pandas=False)
adata_cd8_zheng_2021_merged.uns['cell_subtype_3_prediction_logits'] = predictions_logits[0].detach().cpu().numpy()
adata_cd8_zheng_2021_merged.uns['cell_subtype_zheng_2021_prediction_logits'] = predictions_logits[1][0].detach().cpu().numpy()
adata_cd8_zheng_2021_merged.obs['cell_subtype_3_prediction'] = list(predictions['cell_subtype_3'])
adata_cd8_zheng_2021_merged.obs['cell_subtype_zheng_2021_prediction'] = list(predictions['cell_subtype_zheng_2021'])
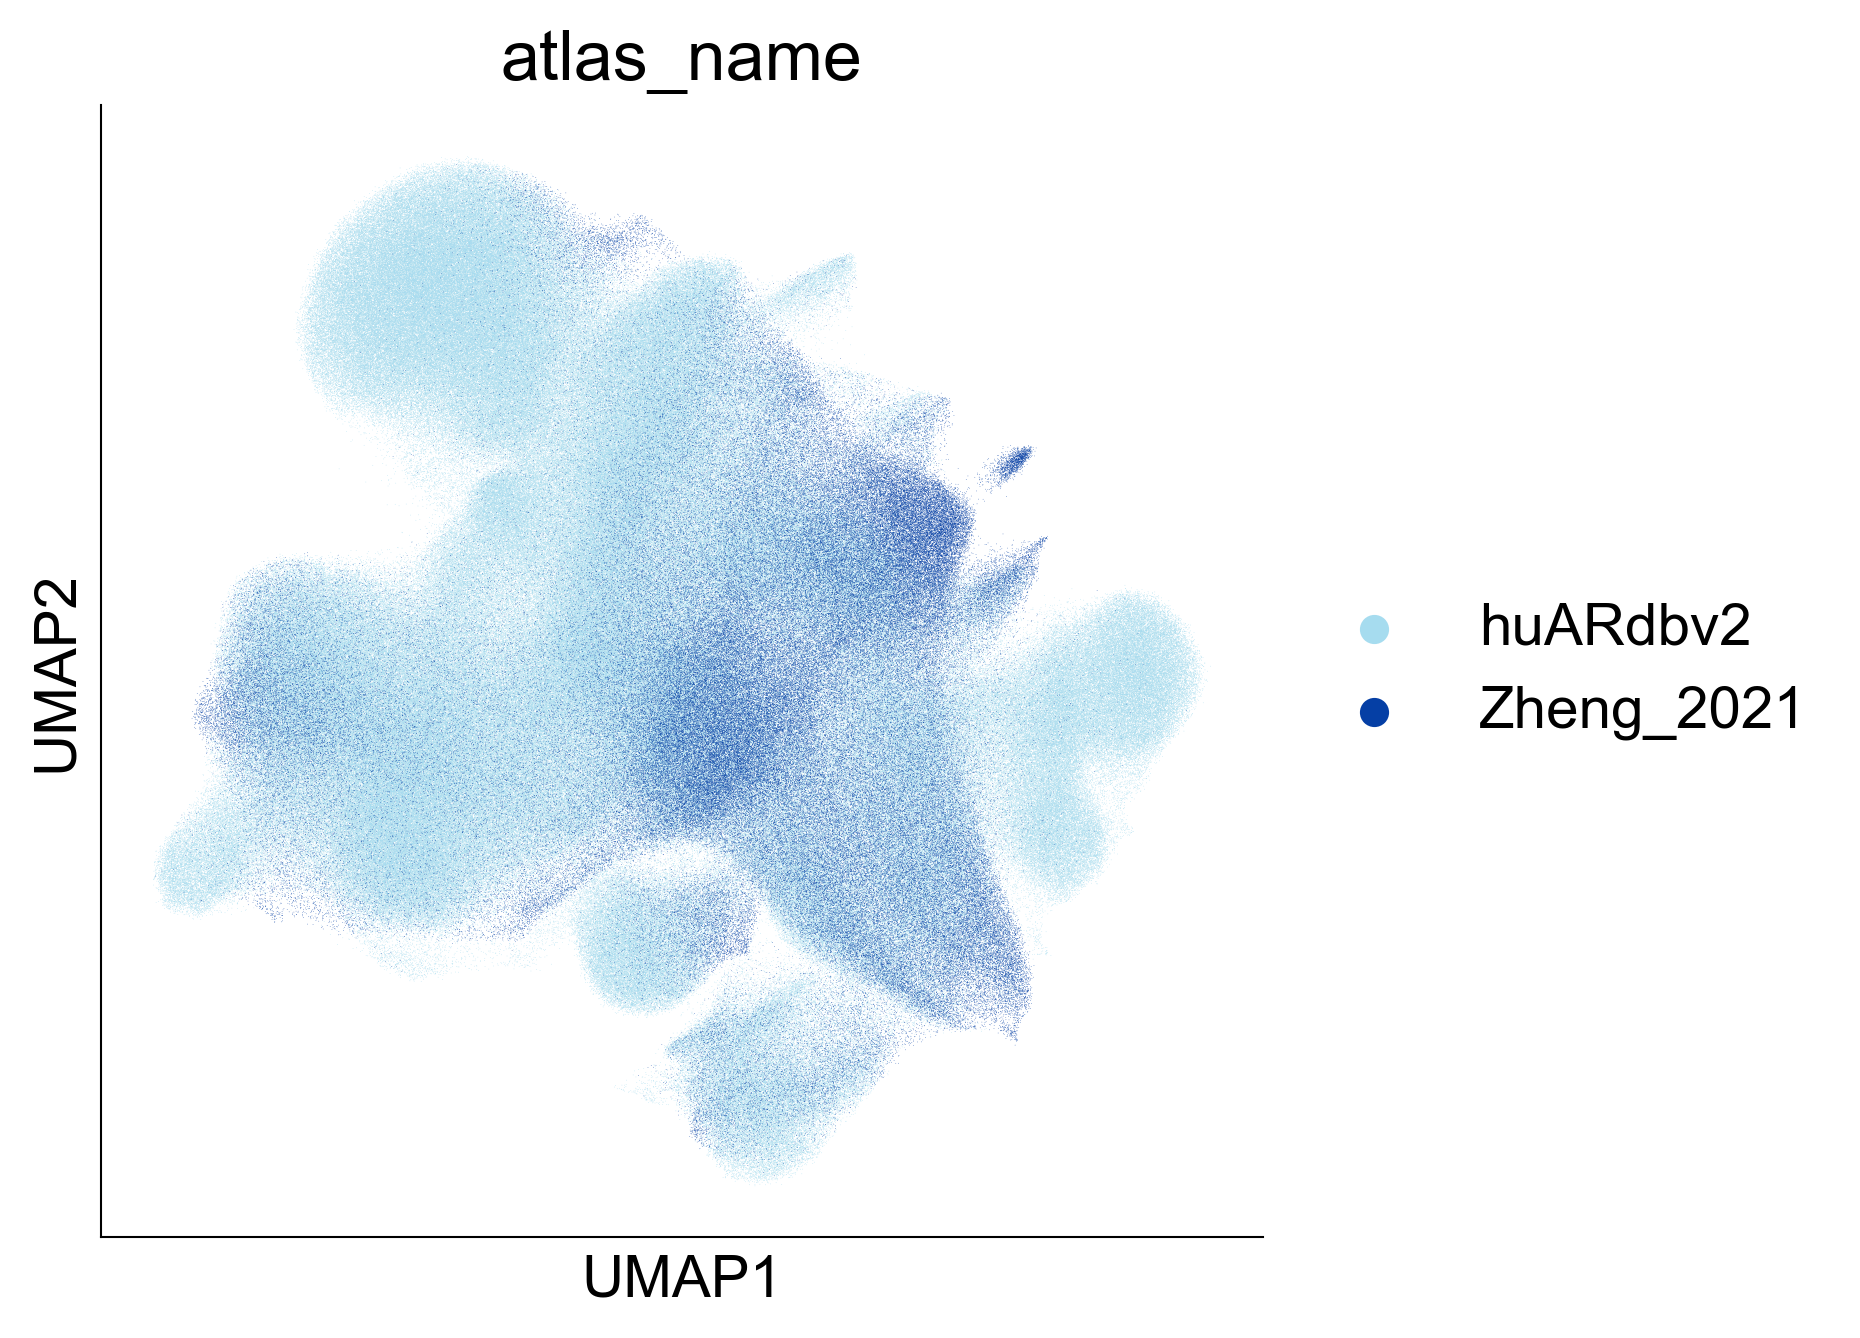
Extended Data Figure 9A
fig,ax=createFig(figsize=(5,5))
sc.pl.umap(adata_cd8_zheng_2021_merged[adata_cd8_zheng_2021_merged.obs['atlas_name'] == 'huARdbv2'], color='atlas_name', ax=ax, palette=
 {
     'Zheng_2021': '#053FA5',
     'huARdbv2': '#A6DCEF'
 }, show=False, s=0.1
)
sc.pl.umap(adata_cd8_zheng_2021_merged[adata_cd8_zheng_2021_merged.obs['atlas_name'] != 'huARdbv2'], color='atlas_name', ax=ax, palette=
 {
     'Zheng_2021': '#053FA5',
     'huARdbv2': '#A6DCEF'
 }, show=False, s=0.1
)
fig.savefig("/Users/snow/Desktop/tmp.png")
/usr/local/lib/python3.9/site-packages/anndata/compat/_overloaded_dict.py:106: ImplicitModificationWarning: Trying to modify attribute `._uns` of view, initializing view as actual.
  self.data[key] = value
/usr/local/Cellar/python@3.9/3.9.18_1/Frameworks/Python.framework/Versions/3.9/lib/python3.9/contextlib.py:126: FutureWarning: X.dtype being converted to np.float32 from int32. In the next version of anndata (0.9) conversion will not be automatic. Pass dtype explicitly to avoid this warning. Pass `AnnData(X, dtype=X.dtype, ...)` to get the future behavour.
  next(self.gen)
/usr/local/lib/python3.9/site-packages/scanpy/plotting/_tools/scatterplots.py:394: UserWarning: No data for colormapping provided via 'c'. Parameters 'cmap' will be ignored
  cax = scatter(
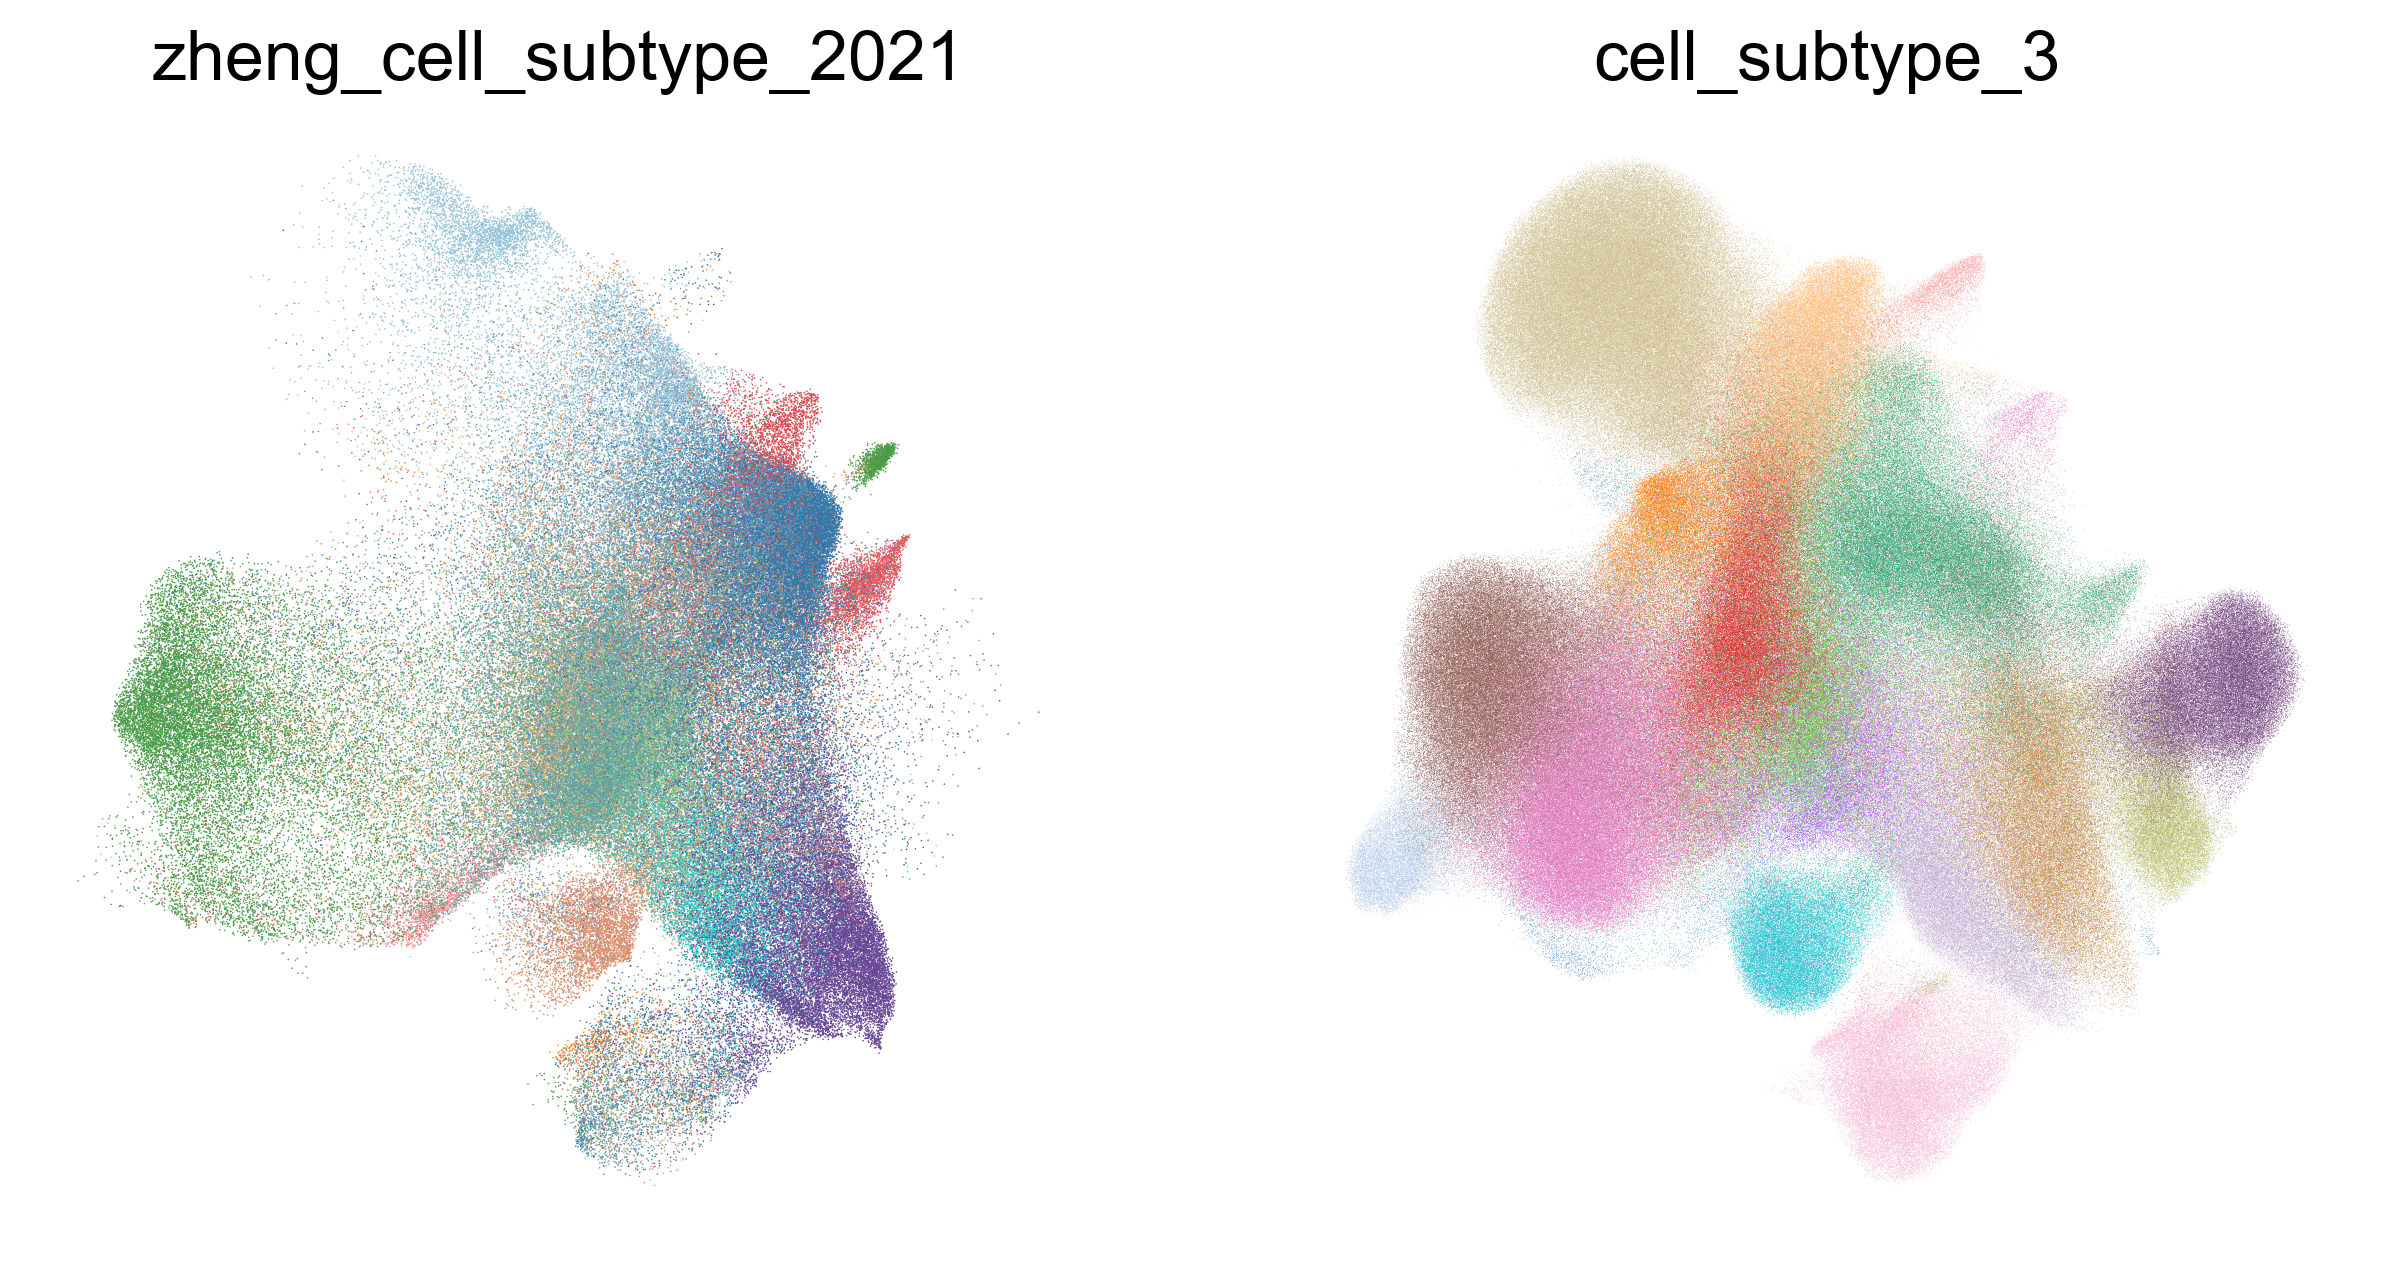
zheng_2021_annotation_cmap_cd8['CD8.c11.Tex.PDCD1'] = '#21D5CE'
fig,ax=createSubplots(1,2,figsize=(10,5))
sc.pl.umap(adata_cd8_zheng_2021_merged[
    adata_cd8_zheng_2021_merged.obs['zheng_cell_subtype_2021'] != 'undefined'
], color='zheng_cell_subtype_2021', ax=ax[0], show=False, palette=zheng_2021_annotation_cmap_cd8, frameon=False, legend_loc='none')
sc.pl.umap(adata_cd8_zheng_2021_merged[
    adata_cd8_zheng_2021_merged.obs['cell_subtype_3'] != 'undefined'
], color='cell_subtype_3', ax=ax[1], palette=subtype_color, frameon=False, legend_loc='none')
/usr/local/lib/python3.9/site-packages/anndata/compat/_overloaded_dict.py:106: ImplicitModificationWarning: Trying to modify attribute `._uns` of view, initializing view as actual.
  self.data[key] = value
/usr/local/Cellar/python@3.9/3.9.18_1/Frameworks/Python.framework/Versions/3.9/lib/python3.9/contextlib.py:126: FutureWarning: X.dtype being converted to np.float32 from int32. In the next version of anndata (0.9) conversion will not be automatic. Pass dtype explicitly to avoid this warning. Pass `AnnData(X, dtype=X.dtype, ...)` to get the future behavour.
  next(self.gen)
/usr/local/lib/python3.9/site-packages/scanpy/plotting/_tools/scatterplots.py:394: UserWarning: No data for colormapping provided via 'c'. Parameters 'cmap' will be ignored
  cax = scatter(
_, fig = scatlasvae.tl.cell_type_alignment(
    adata_cd8_zheng_2021_merged,
    obs_1 = 'cell_subtype_zheng_2021',
    obs_2 = 'cell_subtype_3_prediction',
    perc_in_obs_1 = 0.2
)
Cross-atlas integration between pan-disease CD8 atlas and Chu et al., 2023 TCellMap
Note
For training scAtlasVAE model you will need CUDA available.
Please see the PyTorch official website for installing GPU-enabled version of PyTorch.
adata_cd8_chu_2023.obs['cell_subtype_3'] = 'undefined'
adata_cd8.obs['cell_subtype_3'] = list(pd.read_csv("/rsch/Snowxue/2023-NM-Revision-GEX-HuARdb-Notebooks/huARdb_v2_GEX.CD8.hvg4k.20231116.obs.cell_subtype_3.csv")['cell_subtype_3'])
adata_cd8.obs['label_4'] = 'undefined'
adata_cd8.obs['atlas_name'] = 'huARdbv2'


adata_cd8_chu_2023_merged = sc.concat([
    adata_cd8_chu_2023, adata_cd8
], join='inner')

adata_cd8_chu_2023_merged.obs['cell_subtype_3'] = list(adata_cd8_chu_2023_merged.obs['cell_subtype_3'])
adata_cd8_chu_2023_merged.obs['cell_subtype_3'] = adata_cd8_chu_2023_merged.obs['cell_subtype_3'].fillna("undefined")

multi_atlas_vae_model = scatlasvae.model.scAtlasVAE(
    adata=adata_cd8_chu_2023_merged,
    batch_key='sample_name',
    additional_batch_keys=['study_name','atlas_name'],
    batch_embedding='embedding',
    batch_hidden_dim=64,
    label_key='cell_subtype_3',
    additional_label_keys=['cell_subtype_chu_2023'],
    device='cuda:2'
)

_ = multi_atlas_vae_model.fit(
    max_epoch=32,
    lr=5e-5,
    kl_weight=1.,
    n_epochs_kl_warmup=16
)
import umap
adata_cd8_chu_2023_merged.obsm['X_gex'] = multi_atlas_vae_model.get_latent_embedding()
adata_cd8_chu_2023_merged.obsm['X_umap'] = umap.UMAP().fit_transform(adata_cd8_chu_2023_merged.obsm['X_gex'])

predictions = multi_atlas_vae_model.predict_labels(return_pandas=True)
predictions_logits = multi_atlas_vae_model.predict_labels(return_pandas=False)
adata_cd8_chu_2023_merged.uns['cell_subtype_3_prediction_logits'] = predictions_logits[0].detach().cpu().numpy()
adata_cd8_chu_2023_merged.uns['cell_subtype_chu_2023_prediction_logits'] = predictions_logits[1][0].detach().cpu().numpy()
adata_cd8_chu_2023_merged.obs['cell_subtype_3_prediction'] = list(predictions['cell_subtype_3'])
adata_cd8_chu_2023_merged.obs['cell_subtype_chu_2023_prediction'] = list(predictions['cell_subtype_chu_2023'])
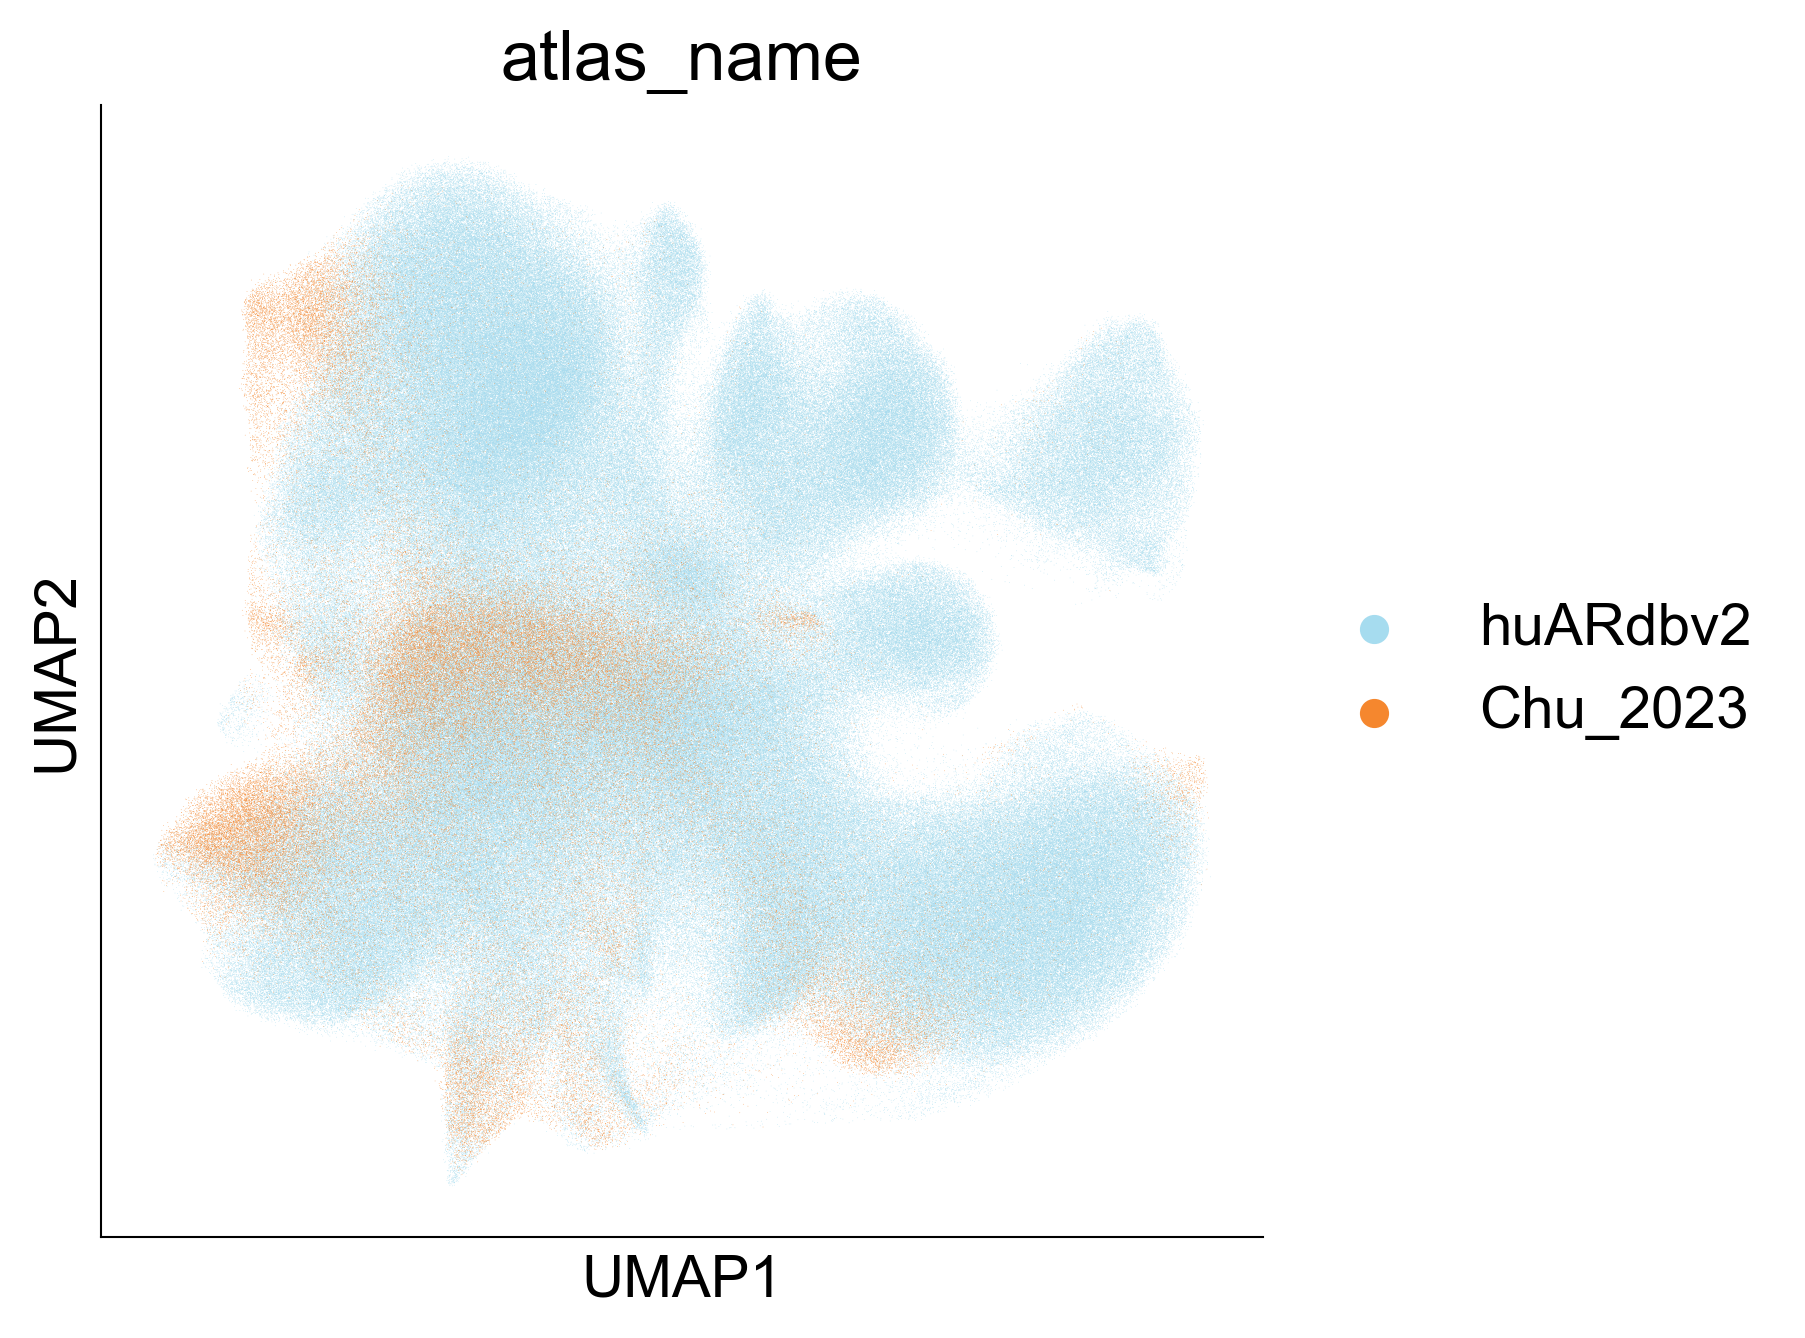
Extended Data Figure 9B
fig,ax=createFig(figsize=(5,5))
sc.pl.umap(adata_cd8_chu_2023_merged[adata_cd8_chu_2023_merged.obs['atlas_name'] == 'huARdbv2'], color='atlas_name', ax=ax, palette=
 {
     'Chu_2023': '#F5872E',
     'huARdbv2': '#A6DCEF'
 }, show=False, s=0.1
)
sc.pl.umap(adata_cd8_chu_2023_merged[adata_cd8_chu_2023_merged.obs['atlas_name'] != 'huARdbv2'], color='atlas_name', ax=ax, palette=
 {
     'Chu_2023': '#F5872E',
     'huARdbv2': '#A6DCEF'
 }, show=False, s=0.1
)
fig.savefig("/Users/snow/Desktop/tmp.png")
/usr/local/lib/python3.9/site-packages/anndata/compat/_overloaded_dict.py:106: ImplicitModificationWarning:

Trying to modify attribute `._uns` of view, initializing view as actual.

/usr/local/Cellar/python@3.9/3.9.18_1/Frameworks/Python.framework/Versions/3.9/lib/python3.9/contextlib.py:126: FutureWarning:

X.dtype being converted to np.float32 from float64. In the next version of anndata (0.9) conversion will not be automatic. Pass dtype explicitly to avoid this warning. Pass `AnnData(X, dtype=X.dtype, ...)` to get the future behavour.

/usr/local/lib/python3.9/site-packages/scanpy/plotting/_tools/scatterplots.py:394: UserWarning:

No data for colormapping provided via 'c'. Parameters 'cmap' will be ignored
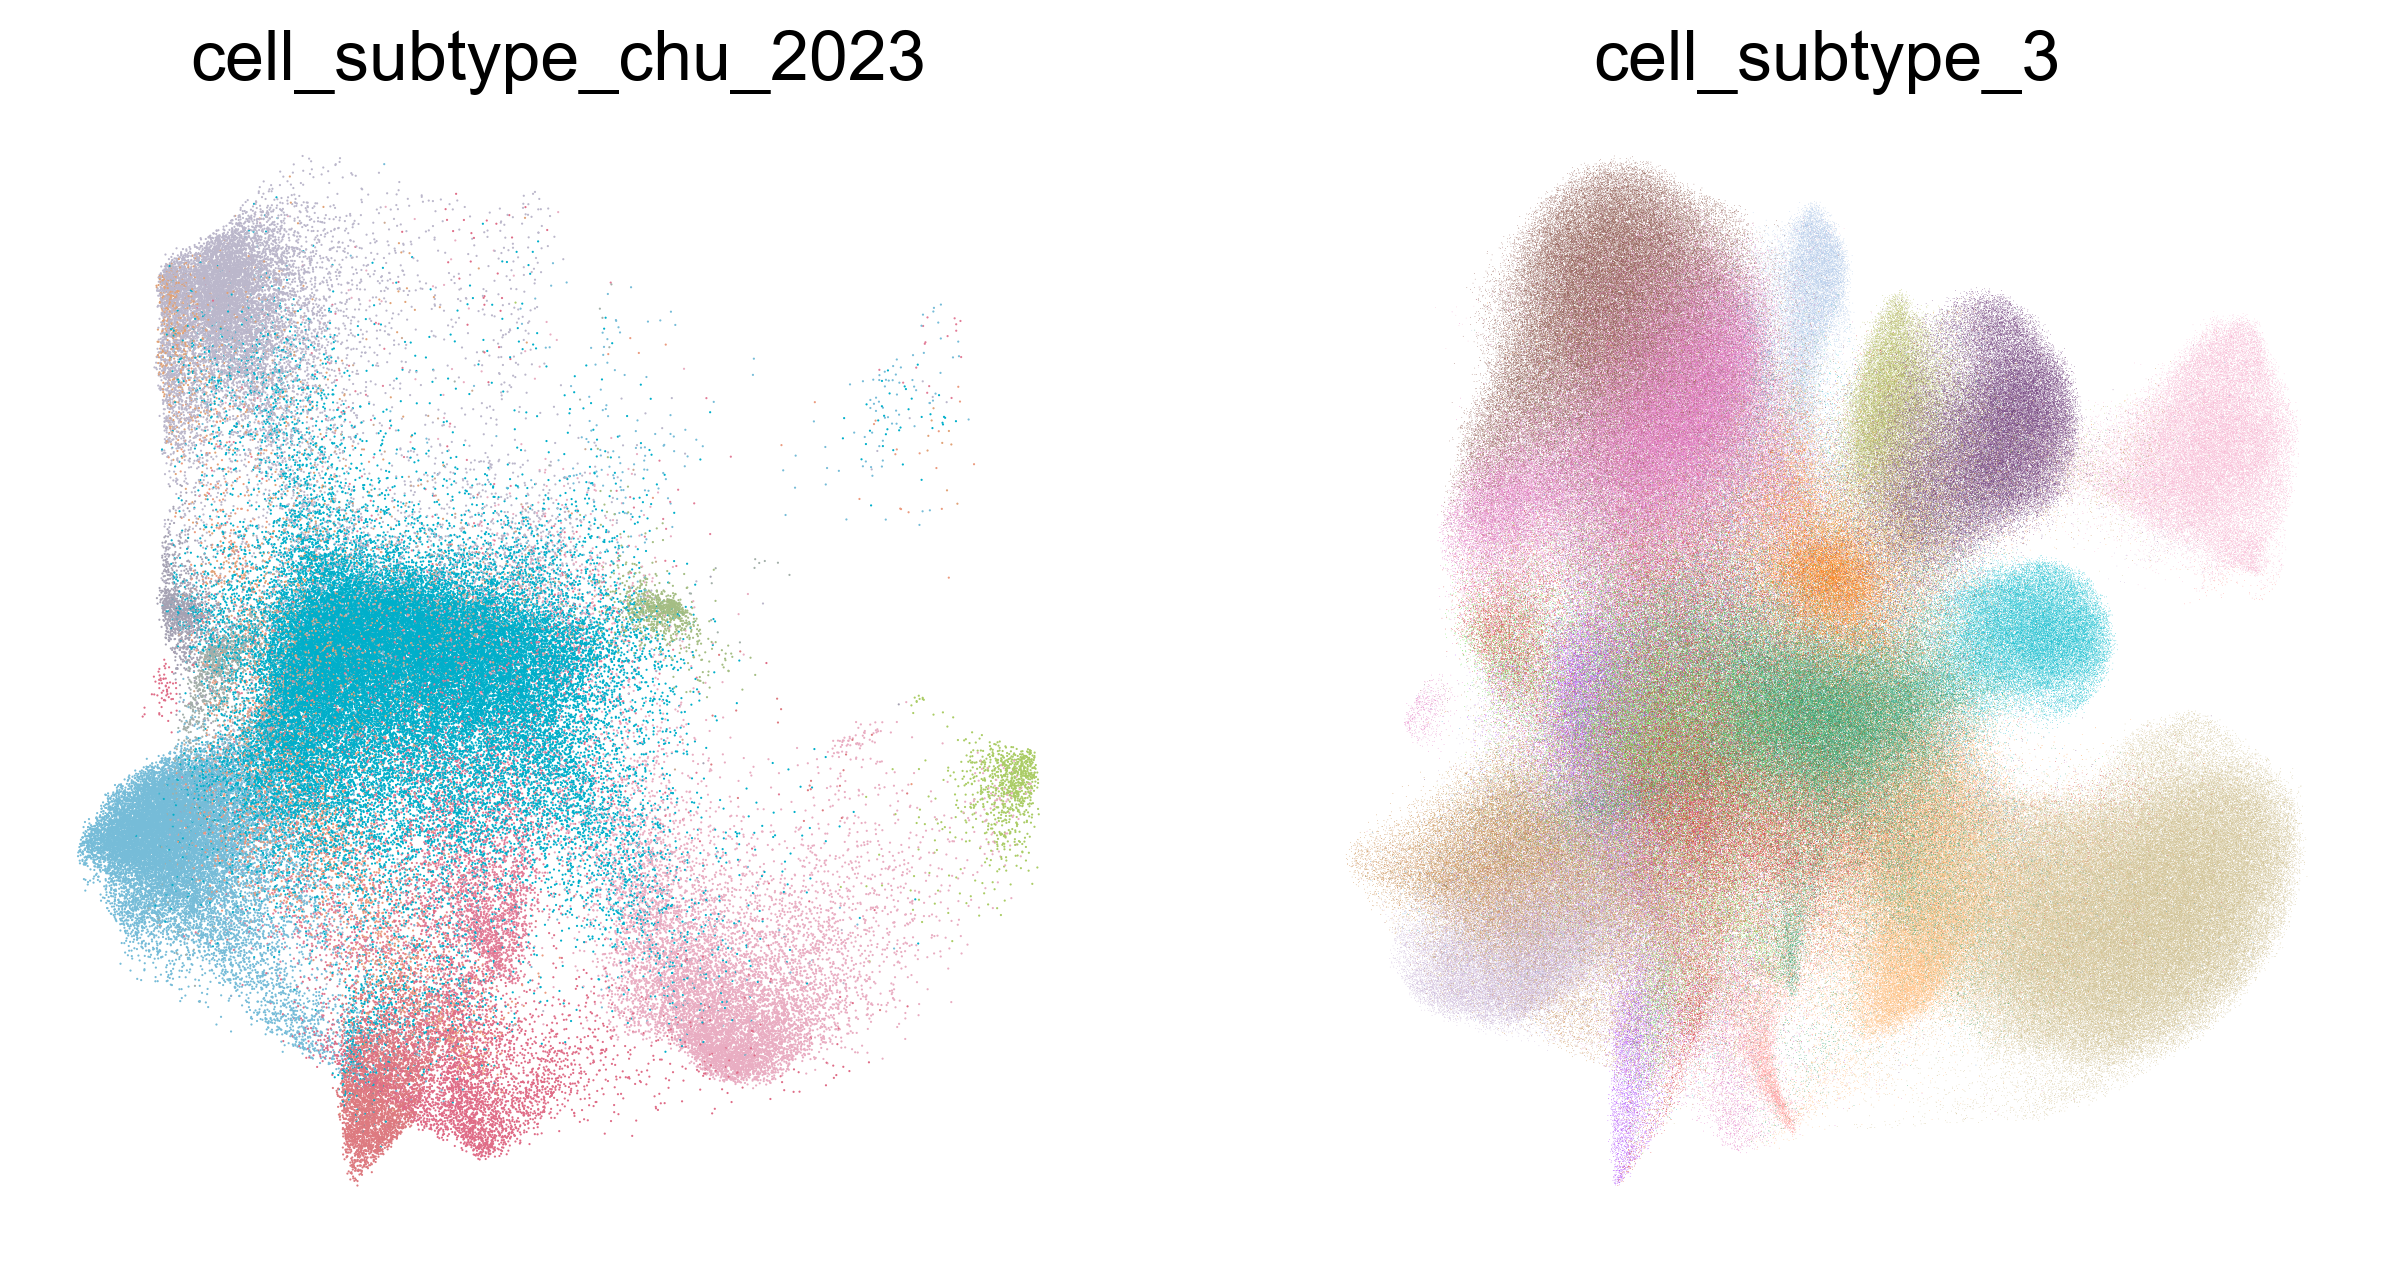
fig,ax=createSubplots(1,2,figsize=(10,5))
obsm = adata_cd8_chu_2023_merged.obsm['X_umap']

sc.pl.umap(adata_cd8_chu_2023_merged[
    adata_cd8_chu_2023_merged.obs['cell_subtype_chu_2023'] != 'undefined'
], color='cell_subtype_chu_2023', ax=ax[0], show=False, palette=chu_annotation_cmap_2, frameon=False, legend_loc='none')
sc.pl.umap(adata_cd8_chu_2023_merged[
    adata_cd8_chu_2023_merged.obs['cell_subtype_3'] != 'undefined'
], color='cell_subtype_3', ax=ax[1], palette=subtype_color, frameon=False, legend_loc='none')
fig.savefig("/Users/snow/Desktop/tmp.png")
plt.show()
/usr/local/lib/python3.9/site-packages/anndata/compat/_overloaded_dict.py:106: ImplicitModificationWarning: Trying to modify attribute `._uns` of view, initializing view as actual.
  self.data[key] = value
/usr/local/Cellar/python@3.9/3.9.18_1/Frameworks/Python.framework/Versions/3.9/lib/python3.9/contextlib.py:126: FutureWarning: X.dtype being converted to np.float32 from float64. In the next version of anndata (0.9) conversion will not be automatic. Pass dtype explicitly to avoid this warning. Pass `AnnData(X, dtype=X.dtype, ...)` to get the future behavour.
  next(self.gen)
/usr/local/lib/python3.9/site-packages/scanpy/plotting/_tools/scatterplots.py:394: UserWarning: No data for colormapping provided via 'c'. Parameters 'cmap' will be ignored
  cax = scatter(
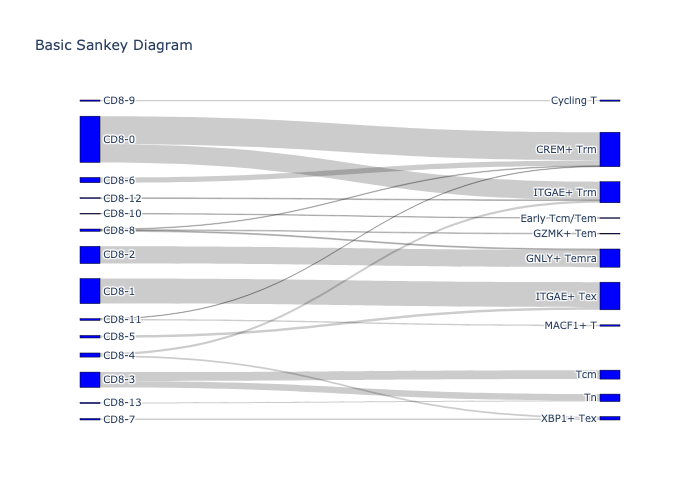
_, fig = scatlasvae.tl.cell_type_alignment(
    adata_cd8_chu_2023_merged,
    obs_1 = 'cell_subtype_chu_2023',
    obs_2 = 'cell_subtype_3_prediction',
    perc_in_obs_1 = 0.2
)
Cross-atlas integration of Tex subset between pan-disease CD8 atlas and pan-cancer CD8 T landscape
Note
For training scAtlasVAE model you will need CUDA available.
Please see the PyTorch official website for installing GPU-enabled version of PyTorch.
# Load data from Zheng et al., 2021

adata_cd8_zheng_2021 = sc.read_h5ad("../data/adata_cd8_zheng_2021.h5ad")

adata_cd8_zheng_2021_tex_tpex = adata_cd8_zheng_2021[
    adata_cd8_zheng_2021.obs["cell_subtype_zheng_2021"].isin(
        [
            "CD8.c11.Tex.PDCD1",
            "CD8.c12.Tex.CXCL13",
            "CD8.c14.Tex.TCF7",
            "CD8.c15.ISG.IFIT1",
        ]
    )
]

adata_cd8_tex = adata_cd8[
    adata_cd8.obs['cell_subtype_3'].isin([
        'GZMK+ Tex',
        'ITGAE+ Tex',
        'XBP1+ Tex'
    ])
]

adata_cd8_zheng_2021_tex_tpex.obs["cell_subtype_3"] = "undefined"
adata_cd8_tex.obs["cell_subtype_zheng_2021"] = "undefined"
adata_cd8_tex.obs["atlas_name"] = "huARdbv2"


adata_cd8_tex_tpex_merged = sc.concat(
    [adata_cd8_zheng_2021_tex_tpex, adata_cd8_tex], join="inner"
)

adata_cd8_tex_tpex_merged.obs["cell_subtype_3"] = list(
    adata_cd8_tex_tpex_merged.obs["cell_subtype_3"]
)
adata_cd8_tex_tpex_merged.obs["cell_subtype_3"] = adata_cd8_tex_tpex_merged.obs[
    "cell_subtype_3"
].fillna("undefined")

# Using GPU #2
multi_atlas_vae_model = scatlasvae.model.scAtlasVAE(
    adata=adata_cd8_tex_tpex_merged,
    batch_key="sample_name",
    additional_batch_keys=["study_name", "atlas_name"],
    batch_embedding="embedding",
    batch_hidden_dim=64,
    label_key="cell_subtype_3",
    additional_label_keys=["cell_subtype_zheng_2021"],
    device="cuda:2",
)
multi_atlas_vae_model.fit(
    max_epoch=64,
    lr=5e-5,
    kl_weight=1.,
    n_epochs_kl_warmup=32
)
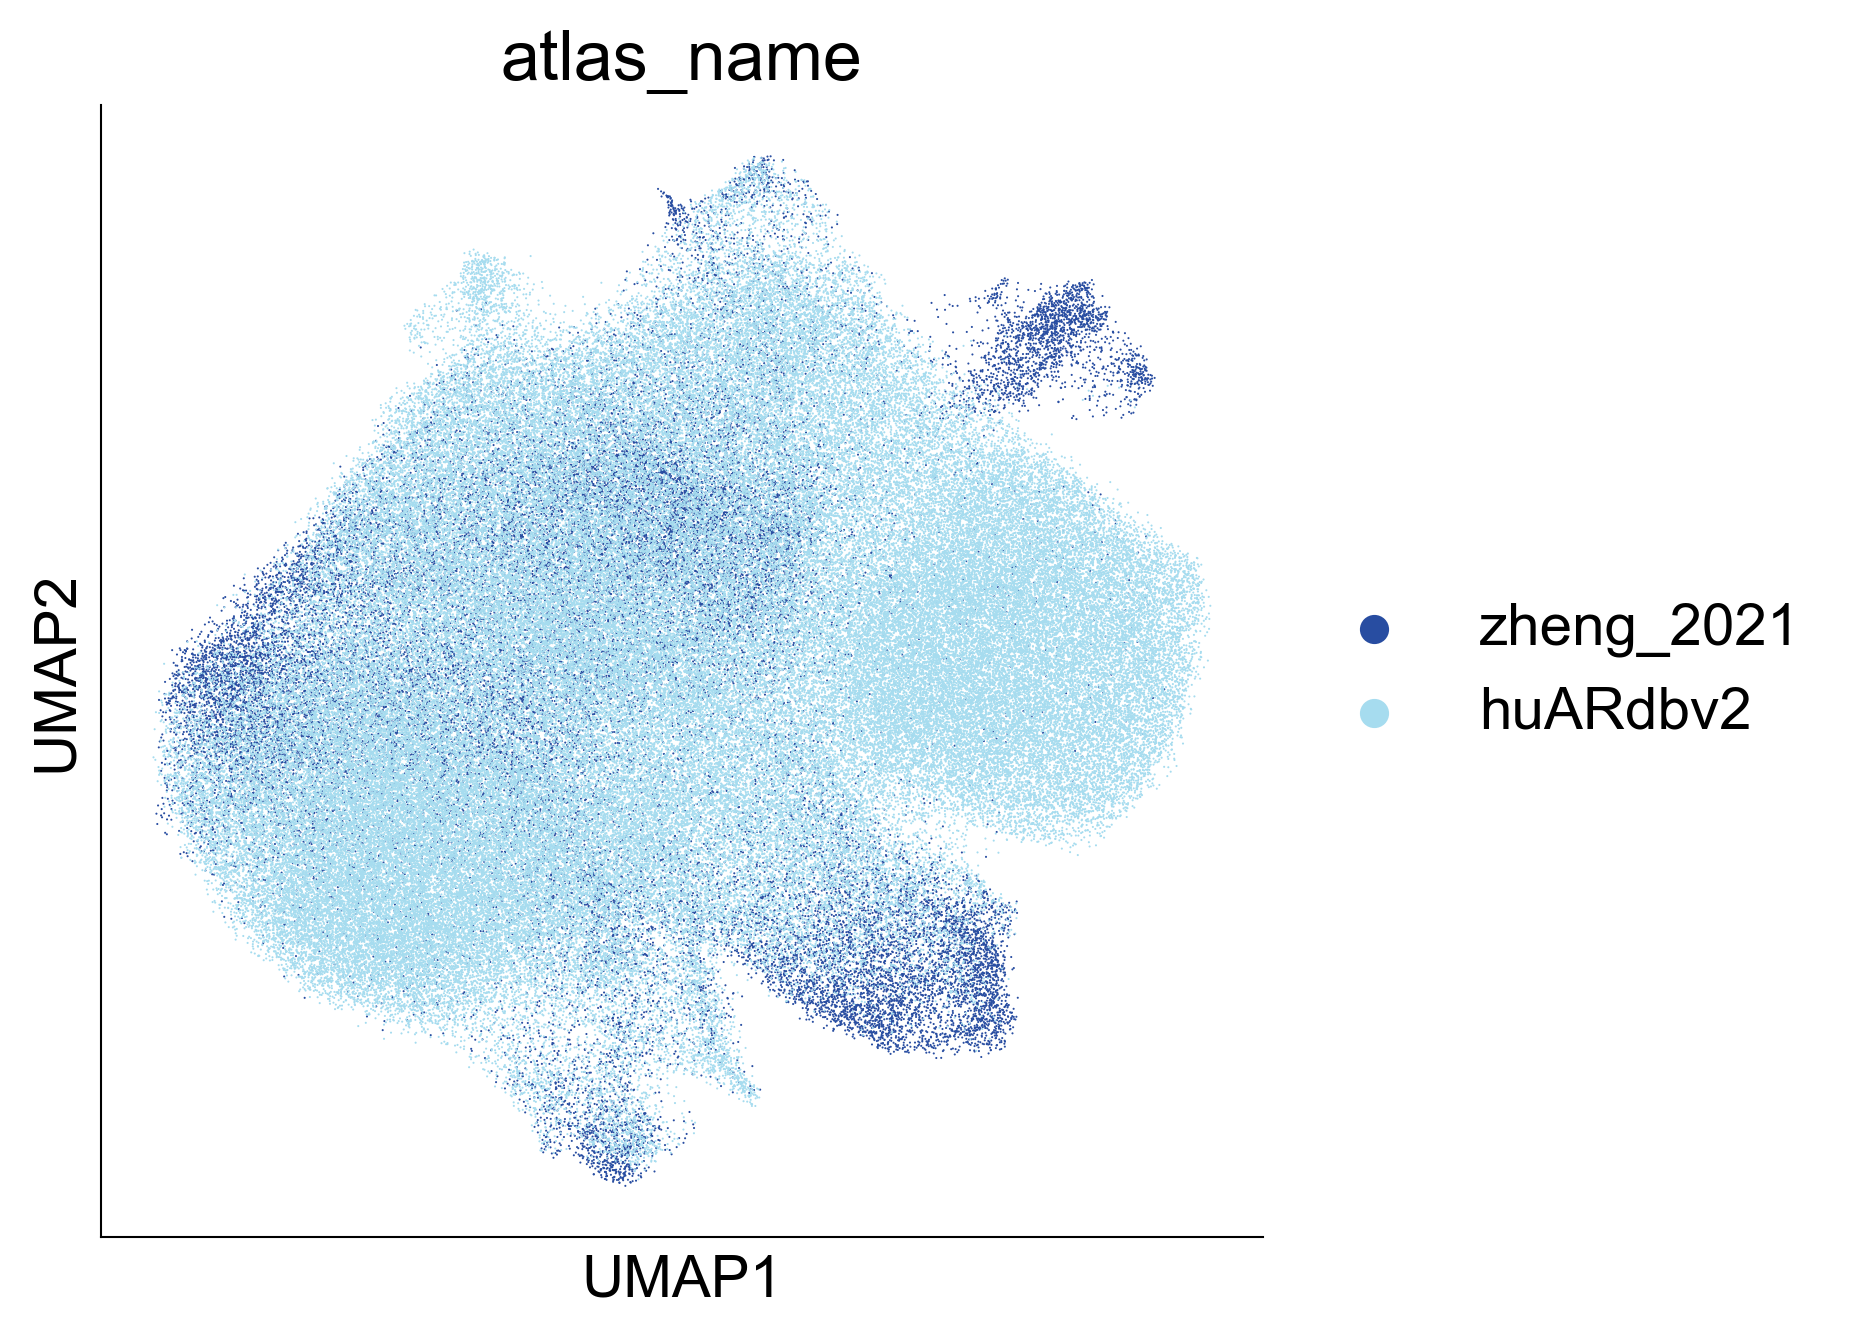
Figure 3F
fig,ax=createFig(figsize=(5,5))
sc.pl.umap(adata_cd8_tex_tpex_merged, color='atlas_name', ax=ax, palette=
 {
    'huARdbv2': '#A6DCEF',
    'zheng_2021': '#284DA1'
 }, show=False, s=1
)
plt.show()
/usr/local/lib/python3.9/site-packages/scanpy/plotting/_tools/scatterplots.py:394: UserWarning: No data for colormapping provided via 'c'. Parameters 'cmap' will be ignored
  cax = scatter(
zheng_2021_annotation_cmap_cd8 = {
    "CD8.c01.Tn.MAL": "#96C3D8",
    "CD8.c02.Tm.IL7R": "#5D9BBE",
    "CD8.c03.Tm.RPS12": "#F5B375",
    "CD8.c04.Tm.CD52": "#C0937E",
    "CD8.c05.Tem.CXCR5": "#67A59B",
    "CD8.c06.Tem.GZMK": "#A4D38E",
    "CD8.c07.Temra.CX3CR1": "#4A9D47",
    "CD8.c08.Tk.TYROBP": "#F19294",
    "CD8.c09.Tk.KIR2DL4": "#E45A5F",
    "CD8.c10.Trm.ZNF683": "#3477A9",
    "CD8.c11.Tex.PDCD1": "#BDA7CB",
    "CD8.c12.Tex.CXCL13": "#684797",
    "CD8.c13.Tex.myl12a": "#9983B7",
    "CD8.c14.Tex.TCF7": "#CD9A99",
    "CD8.c15.ISG.IFIT1": "#DD4B52",
    "CD8.c16.MAIT.SLC4A10": "#DA8F6F",
    "CD8.c17.Tm.NME1": "#F58135",
}

zheng_2021_annotation_cmap_cd8["CD8.c11.Tex.PDCD1"] = "#21D5CE"
fig, ax = createSubplots(1, 2, figsize=(10, 5))

sc.pl.umap(
    adata_cd8_tex_tpex_merged[
        adata_cd8_tex_tpex_merged.obs["cell_subtype_zheng_2021"] != "undefined"
    ],
    color="cell_subtype_zheng_2021",
    ax=ax[1],
    show=False,
    palette=zheng_2021_annotation_cmap_cd8,
    frameon=False,
    legend_loc="none",
)

sc.pl.umap(
    adata_cd8_tex_tpex_merged[
        adata_cd8_tex_tpex_merged.obs["cell_subtype"] != "undefined"
    ],
    color="cell_subtype",
    ax=ax[0],
    palette=subtype_color,
    frameon=False,
    show=False,
    legend_loc="none",
)

plt.show()
fig.savefig("/Users/snow/Desktop/tmp.png")
/usr/local/lib/python3.9/site-packages/anndata/compat/_overloaded_dict.py:106: ImplicitModificationWarning: Trying to modify attribute `._uns` of view, initializing view as actual.
  self.data[key] = value
/usr/local/Cellar/python@3.9/3.9.18_1/Frameworks/Python.framework/Versions/3.9/lib/python3.9/contextlib.py:126: FutureWarning: X.dtype being converted to np.float32 from float64. In the next version of anndata (0.9) conversion will not be automatic. Pass dtype explicitly to avoid this warning. Pass `AnnData(X, dtype=X.dtype, ...)` to get the future behavour.
  next(self.gen)
/usr/local/lib/python3.9/site-packages/scanpy/plotting/_tools/scatterplots.py:394: UserWarning: No data for colormapping provided via 'c'. Parameters 'cmap' will be ignored
  cax = scatter(
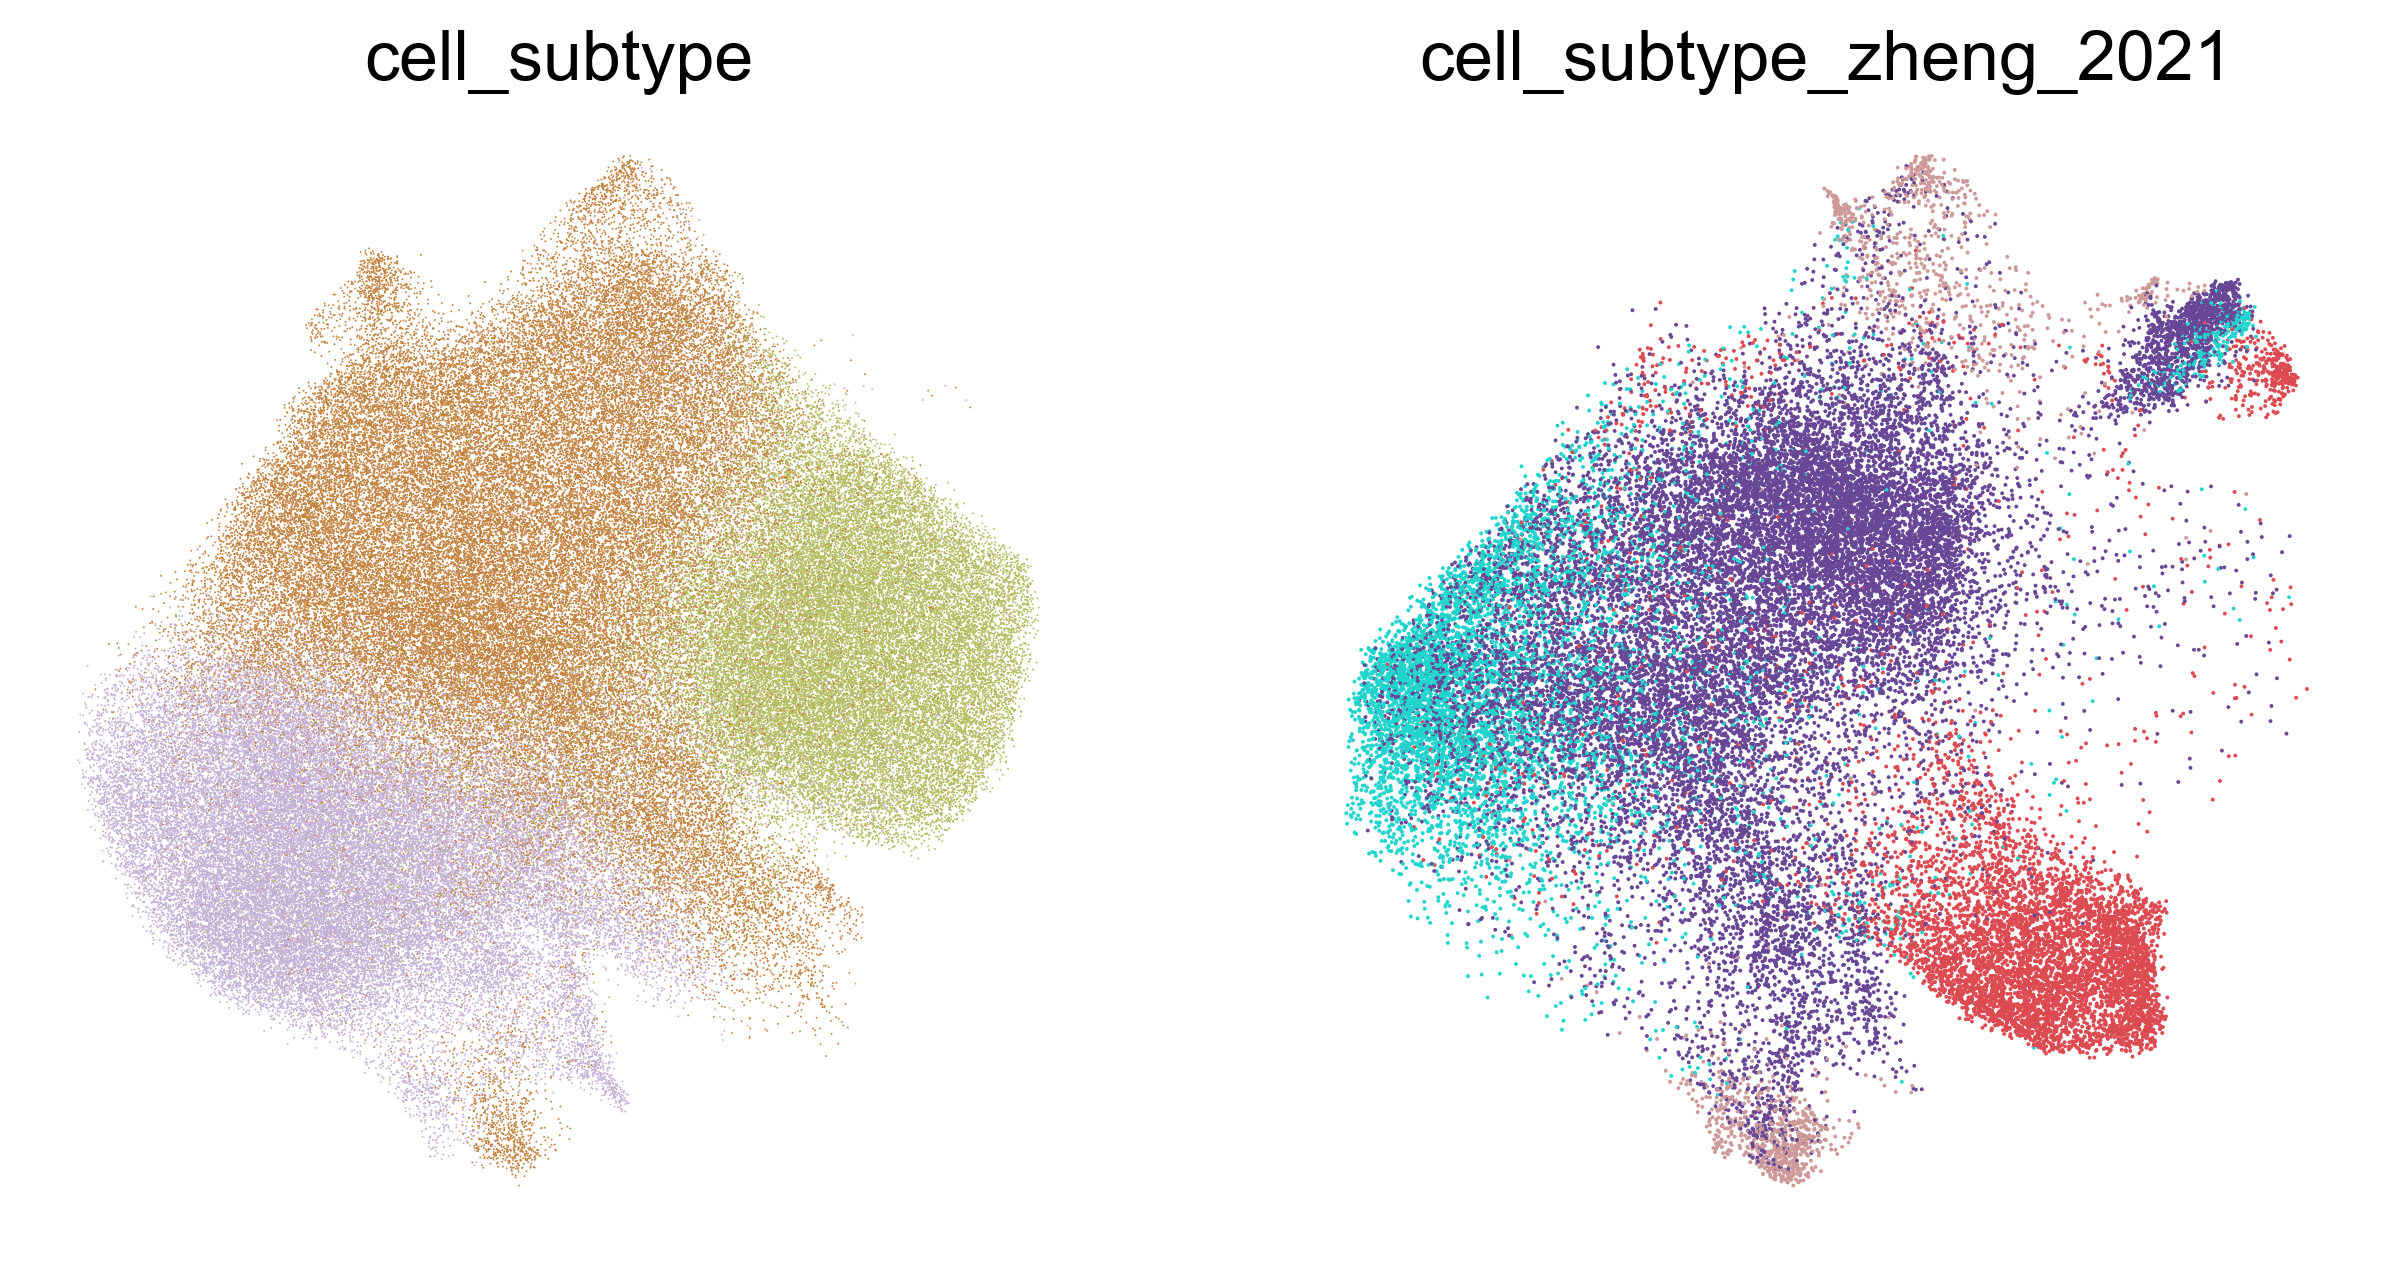
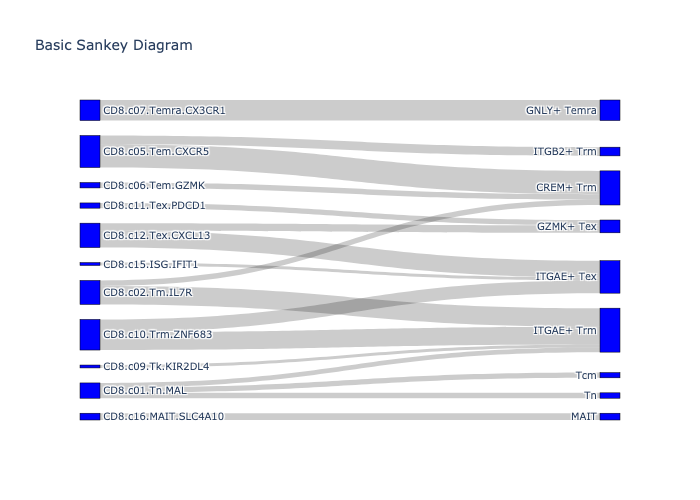
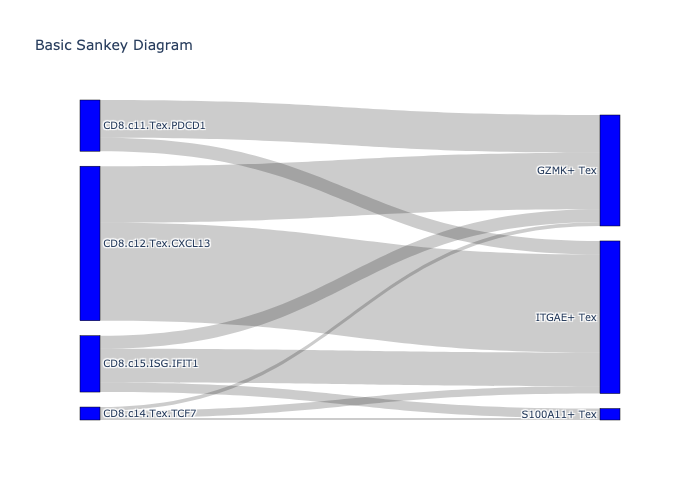
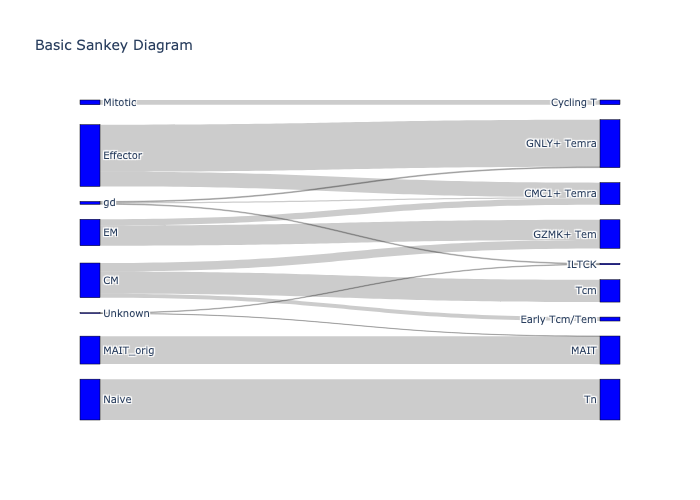
Figure 3G
We use cell type alignment from the scatlasvae package
_, fig = scatlasvae.tl.cell_type_alignment(
    adata_cd8_tex_tpex_merged,
    obs_1='cell_subtype_zheng_2021',
    obs_2='cell_subtype_3_prediction'
)
fig.show(renderer="png")
Supervised integration of pan-disease CD8 T atlas
Note
For training scAtlasVAE model you will need CUDA available.
Please see the PyTorch official website for installing GPU-enabled version of PyTorch.
vae_model = scatlasvae.model.scAtlasVAE(
    adata=adata_cd8,
    batch_key="sample_name",
    additional_batch_keys=["study_name"],
    batch_embedding="embedding",
    batch_hidden_dim=64,
    constrain_latent_embedding=True,
    label_key="cell_subtype_3",
)
vae_model.fit(max_epoch=10, lr=5e-5)
vae_model.save_to_disk("./huARdb_v2_GEX.CD8.hvg4k.supervised.model")
Retrainined MAIT/ILTCK subset for clustering
Note
For training scAtlasVAE model you will need CUDA available.
Please see the PyTorch official website for installing GPU-enabled version of PyTorch.
adata_cd8_iltck_mait = adata_cd8[
    adata_cd8.obs['cell_subtype_3'].isin([
        'MAIT','ILTCK'
    ])
]

import umap

vae_model = scatlasvae.model.scAtlasVAE(
    adata=adata_cd8_iltck_mait,
    batch_key="sample_name",
    additional_batch_keys=["study_name"],
    batch_embedding="embedding",
    batch_hidden_dim=10,
    device="cuda:0",
)
result = vae_model.fit(max_epoch=32, n_epochs_kl_warmup=16, lr=5e-5, kl_weight=3.0)
adata_cd8_iltck_mait.obsm["X_retrain_gex"] = vae_model.get_latent_embedding()
adata_cd8_iltck_mait.obsm["X_retrain_umap"] = umap.UMAP().fit_transform(
    adata_cd8_iltck_mait.obsm["X_retrain_gex"]
)
import scanpy as sc
adata_mait_iltck = sc.read_h5ad("/Users/snow/Desktop/2023-NM-Revision-GEX-HuARdb-Notebooks/data/huARdb_v2_GEX.CD8.hvg4k.20231116.ILTCK_MAIT.vae.h5ad")
tcr_df = pd.read_csv("/Users/snow/Desktop/2023-NM-Revision-GEX-HuARdb-Notebooks/data/huARdb_v2_GEX.CD8.hvg4k.TCR.csv", index_col=0)
adata_mait_iltck.obs = adata_mait_iltck.obs.join(tcr_df.loc[adata_mait_iltck.obs.index])
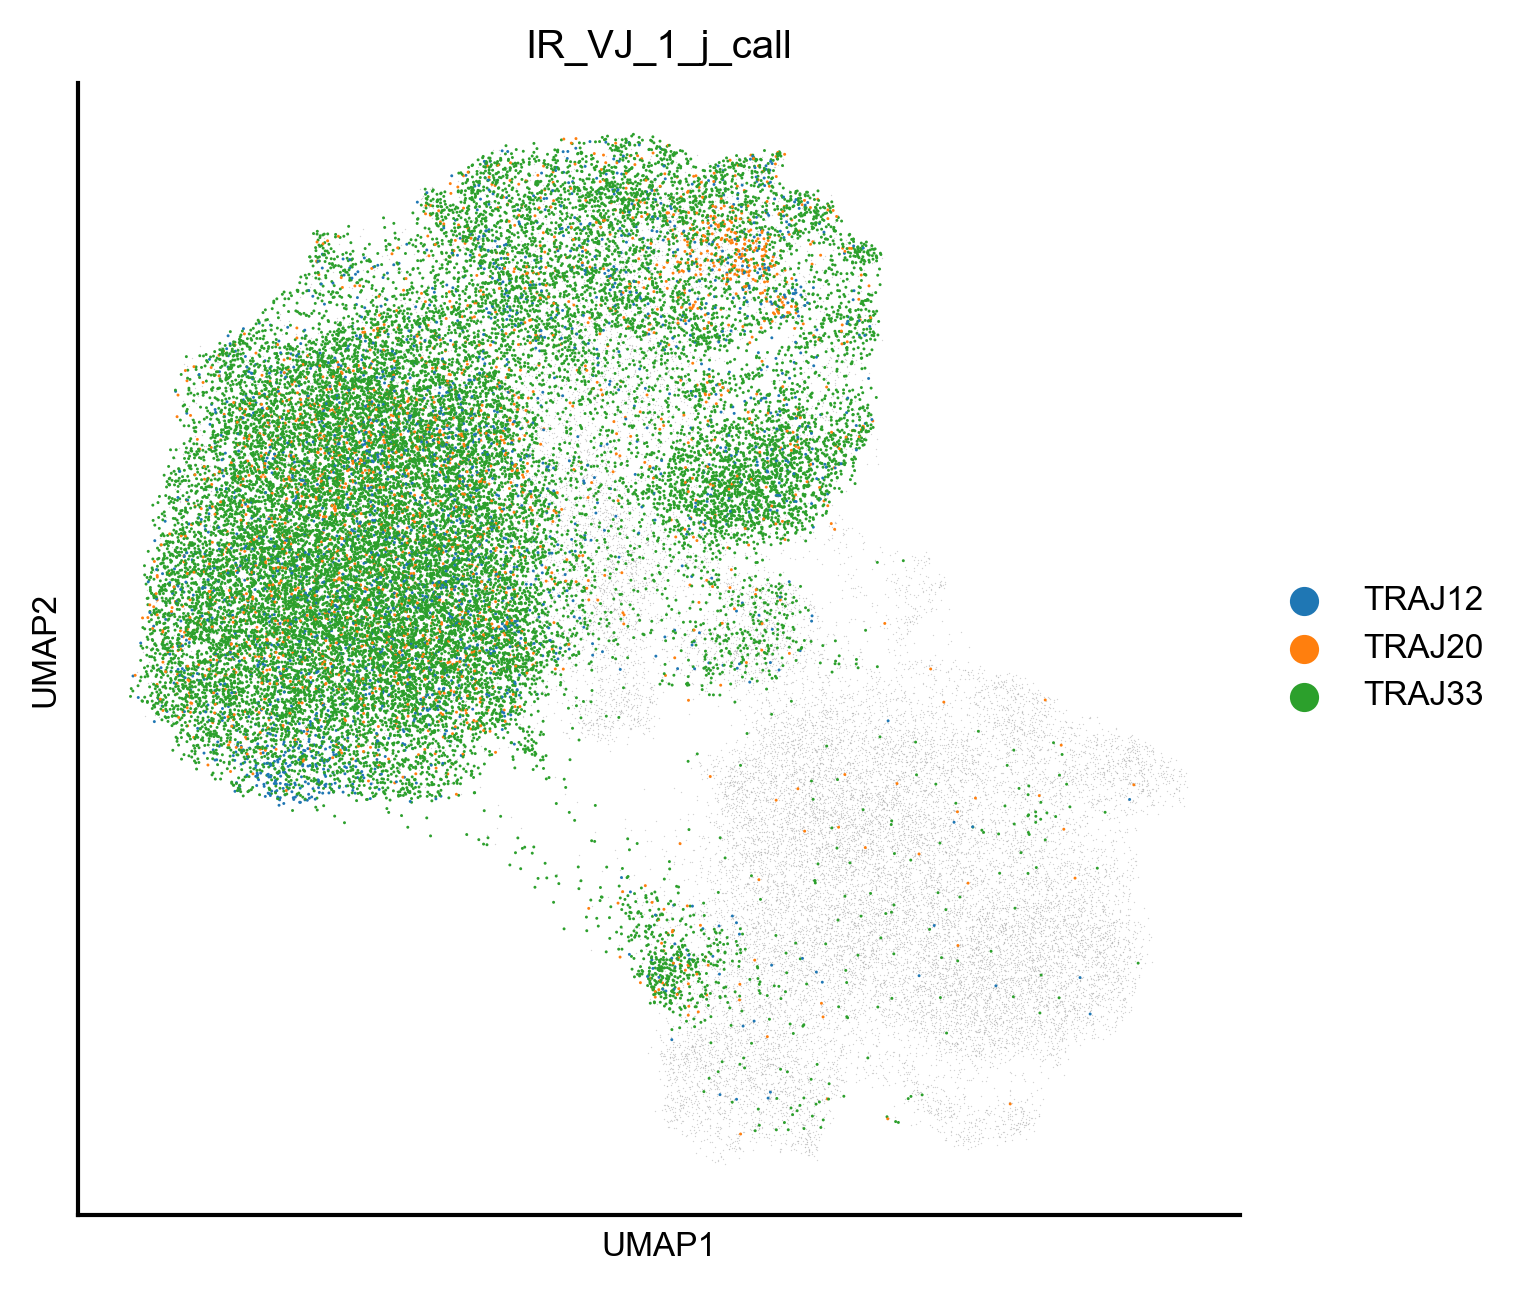
Extended Data Figure 8i
fig,ax=createFig(figsize=(5,5))
import scanpy as sc
obsm = adata_mait_iltck.obsm['X_umap']
ax.scatter(
        obsm[:,0],
        obsm[:,1],
        lw=0,
        c='#A7A7A7',
        s=0.1,
        alpha=0.5
)
sc.pl.umap(
    adata_mait_iltck[
        np.array(adata_mait_iltck.obs['IR_VJ_1_v_call'] == 'TRAV1-2') & (
            np.array(adata_mait_iltck.obs['IR_VJ_1_j_call'] == 'TRAJ33') |
            np.array(adata_mait_iltck.obs['IR_VJ_1_j_call'] == 'TRAJ20') |
            np.array(adata_mait_iltck.obs['IR_VJ_1_j_call'] == 'TRAJ12')
        )
    ],
    color='IR_VJ_1_j_call',
    ax=ax,
    s=2,
    layer='normalized'
)
/usr/local/lib/python3.9/site-packages/anndata/_core/anndata.py:1235: ImplicitModificationWarning: Trying to modify attribute `.obs` of view, initializing view as actual.
  df[key] = c
/usr/local/Cellar/python@3.9/3.9.18_1/Frameworks/Python.framework/Versions/3.9/lib/python3.9/contextlib.py:126: FutureWarning: X.dtype being converted to np.float32 from int32. In the next version of anndata (0.9) conversion will not be automatic. Pass dtype explicitly to avoid this warning. Pass `AnnData(X, dtype=X.dtype, ...)` to get the future behavour.
  next(self.gen)
/usr/local/lib/python3.9/site-packages/anndata/_core/anndata.py:1235: ImplicitModificationWarning: Trying to modify attribute `.obs` of view, initializing view as actual.
  df[key] = c
/usr/local/lib/python3.9/site-packages/scanpy/plotting/_tools/scatterplots.py:394: UserWarning: No data for colormapping provided via 'c'. Parameters 'cmap' will be ignored
  cax = scatter(
fig,ax=createFig(figsize=(5,5))
import scanpy as sc
obsm = adata_mait_iltck.obsm['X_umap']
sc.pl.umap(
    adata_mait_iltck,
    color='study_name',
    ax=ax,
    s=2,
    layer='normalized',
    cmap='Reds'
)
/usr/local/lib/python3.9/site-packages/scanpy/plotting/_tools/scatterplots.py:394: UserWarning: No data for colormapping provided via 'c'. Parameters 'cmap' will be ignored
  cax = scatter(
Extended Data Figure 8h
fig,axes=createSubplots(2,2,figsize=(8,8))
axes=axes.flatten()
import scanpy as sc
obsm = adata_mait_iltck.obsm['X_umap']
sc.pl.umap(
    adata_mait_iltck,
    color='cell_subtype_3',
    ax=axes[0],
    s=1,
    show=False
)
sc.pl.umap(
    adata_mait_iltck,
    color='TYROBP',
    ax=axes[1],
    s=1,
    show=False,
    layer='normalized',
    cmap='Reds'
)
sc.pl.umap(
    adata_mait_iltck,
    color='S100A11',
    ax=axes[2],
    s=1,
    show=False,
    layer='normalized',
    cmap='Reds'
)
sc.pl.umap(
    adata_mait_iltck,
    color='FCER1G',
    ax=axes[3],
    s=1,
    show=True,
    layer='normalized',
    cmap='Reds'
)
plt.show()
/usr/local/lib/python3.9/site-packages/scanpy/plotting/_tools/scatterplots.py:394: UserWarning: No data for colormapping provided via 'c'. Parameters 'cmap' will be ignored
  cax = scatter(
Retraining Tex subset for higher resolution clustering
Note
For training scAtlasVAE model you will need CUDA available.
Please see the PyTorch official website for installing GPU-enabled version of PyTorch.
adata_cd8_tex = adata_cd8[
    adata_cd8.obs['cell_subtype_3'].isin([
        'GZMK+ Tex',
        'ITGAE+ Tex',
        'XBP1+ Tex'
    ])
]
import umap

vae_model = scatlasvae.model.scAtlasVAE(
    adata=adata_cd8_tex,
    batch_key="sample_name",
    additional_batch_keys=["study_name"],
    batch_embedding="embedding",
    batch_hidden_dim=10,
    device="cuda:0",
)
result = vae_model.fit(max_epoch=32, n_epochs_kl_warmup=16, lr=5e-5, kl_weight=3.0)
adata_cd8_tex.obsm["X_retrain_gex"] = vae_model.get_latent_embedding()
adata_cd8_tex.obsm["X_retrain_umap"] = umap.UMAP().fit_transform(
    adata_cd8_tex.obsm["X_retrain_gex"]
)
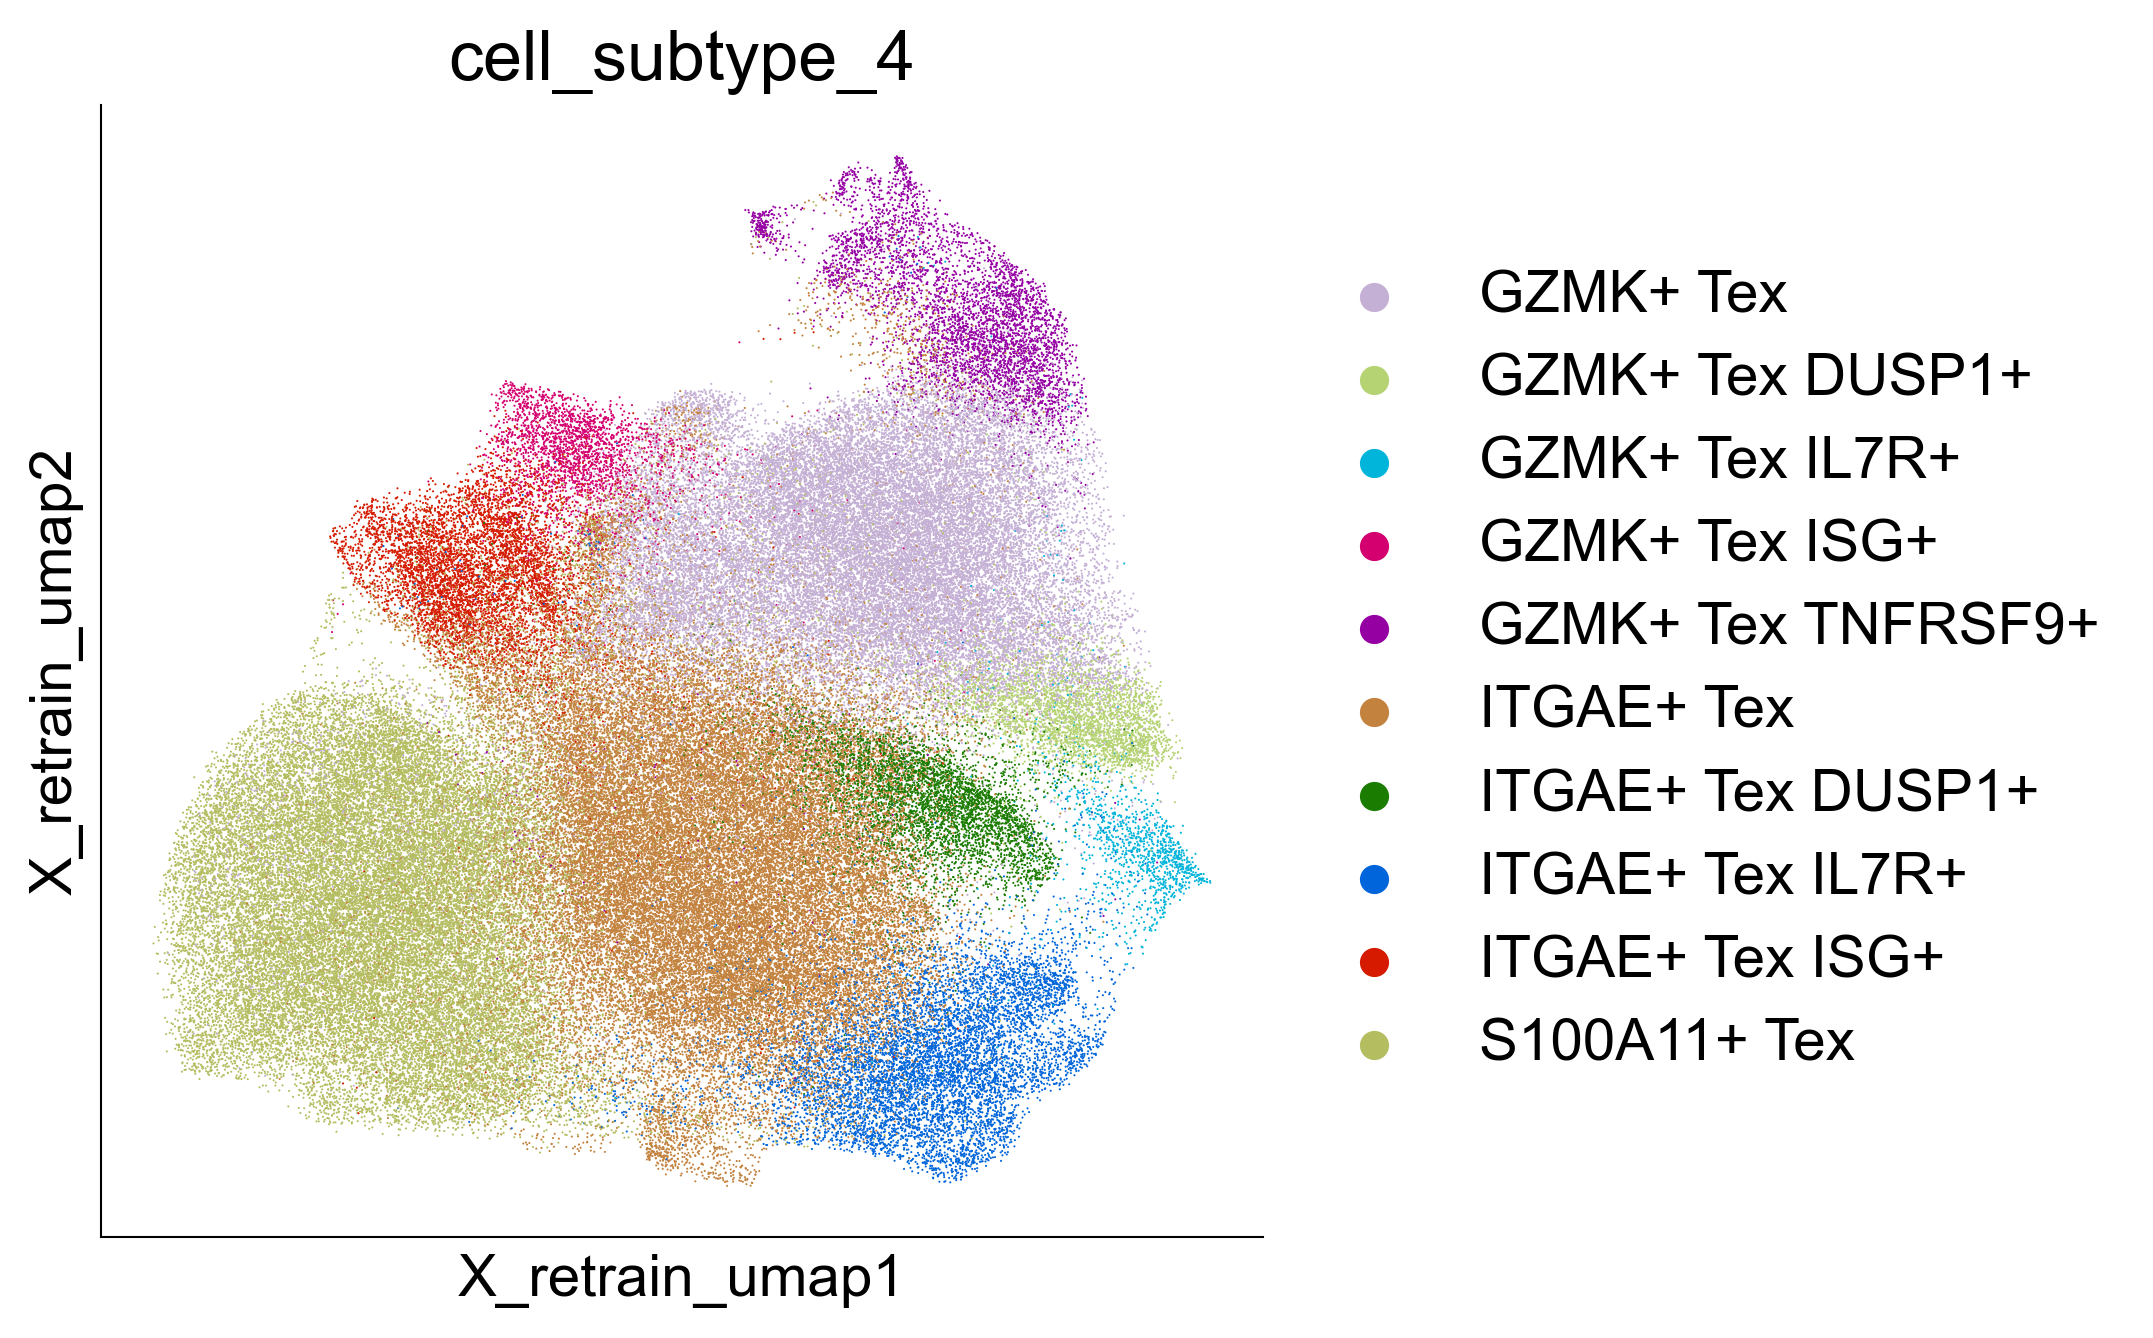
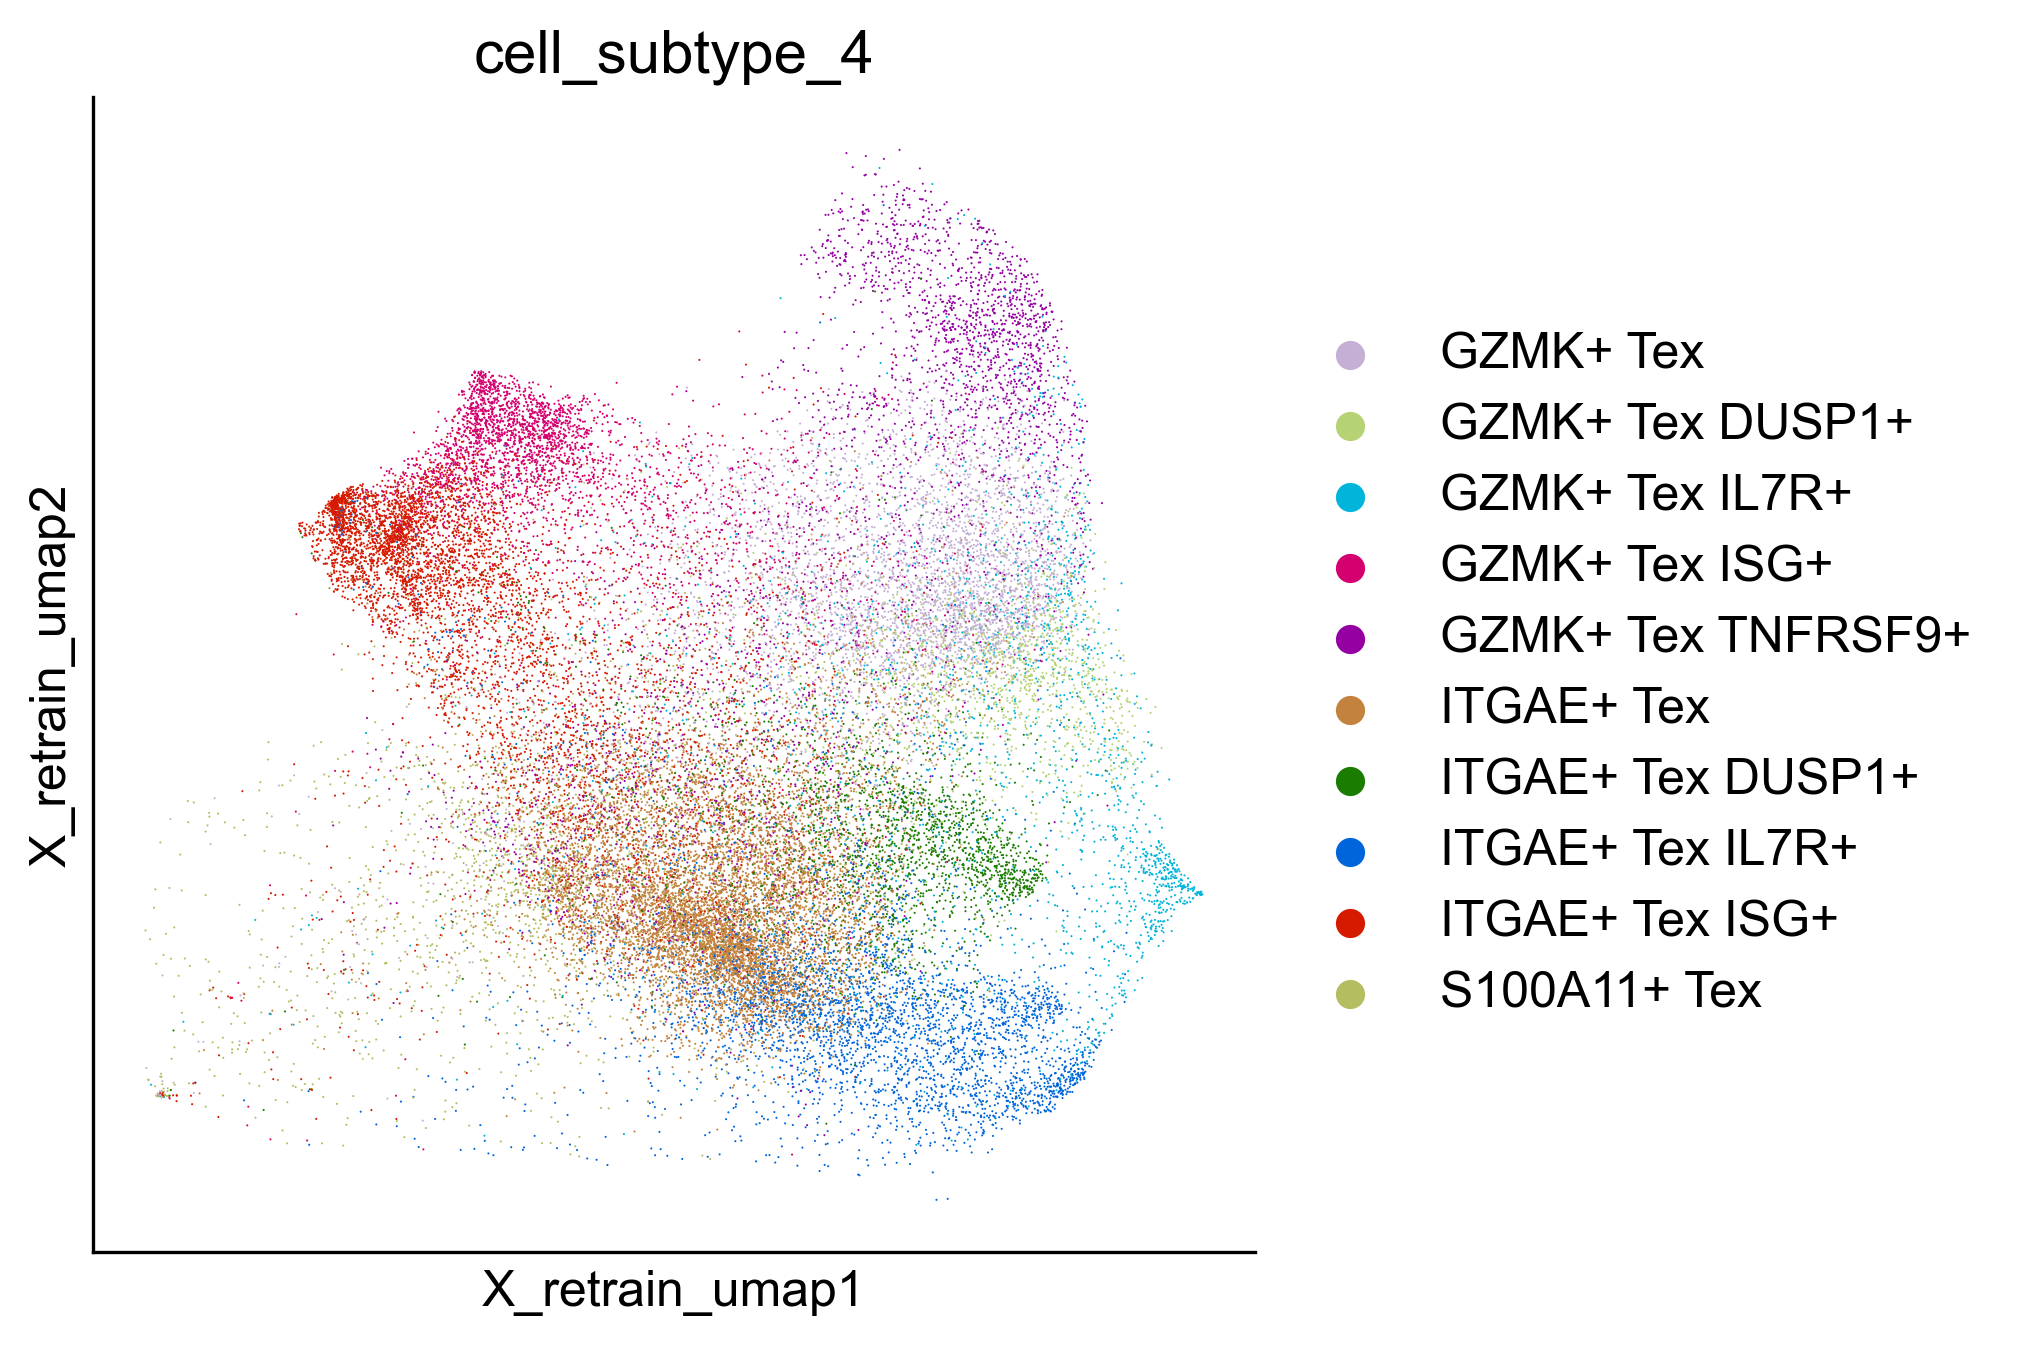
Extended Data Figure 10G
fig, ax = createFig(figsize=(5, 5))

sc.pl.embedding(
    adata_cd8_tex,
    color="cell_subtype_4",
    ax=ax,
    basis="X_retrain_umap",
    layer="normalized",
    cmap="Reds",
    s=1,
)
/usr/local/lib/python3.9/site-packages/scanpy/plotting/_tools/scatterplots.py:394: UserWarning:

No data for colormapping provided via 'c'. Parameters 'cmap' will be ignored
<Figure size 1800x1200 with 0 Axes>
Supervised integration of the Tex subset
Note
For training scAtlasVAE model you will need CUDA available.
Please see the PyTorch official website for installing GPU-enabled version of PyTorch.
tex_vae_model = scatlasvae.model.scAtlasVAE(
    adata=adata_cd8_tex,
    batch_key="sample_name",
    additional_batch_keys=["study_name"],
    batch_embedding="embedding",
    batch_hidden_dim=10,
    label_key="cell_subtype_4",
    device="cuda:2",
    constrain_latent_key="X_gex_retrained_on_4k_hvg",
    constrain_latent_embedding=True,
)
tex_vae_model.fit(
    max_epoch=32, lr=5e-5, kl_weight=1.0, n_epochs_kl_warmup=10, pred_last_n_epoch=22
)
tex_vae_model.save_to_disk("./huARdb_v2_GEX.CD8.hvg4k.Tex.supervised.model")
Query-to-reference mapping to pan-disease CD8 T atlas
Loading query data
adata_bassez_cohort1 = sc.read_h5ad("./transfer_data/Bassez_BC.cohort1.CD8_T.h5ad")
adata_bassez_cohort2 = sc.read_h5ad("./transfer_data/Bassez_BC.cohort2.CD8_T.h5ad")
adata_bi = sc.read_h5ad("./transfer_data/Bi_RCC.CD8_T.h5ad")
adata_caushi = sc.read_h5ad('./transfer_data/Caushi_NSCLC.CD8_T.h5ad')
adata_liu = sc.read_h5ad("./transfer_data/Liu_TNBC.CD8_T.h5ad")
adata_luoma_pbmc = sc.read_h5ad("./transfer_data/Luoma_HNSCC_PBMC.CD8_T.h5ad")
adata_luoma_til = sc.read_h5ad("./transfer_data/Luoma_HNSCC_TIL.CD8_T.h5ad")
adata_watson = sc.read_h5ad("./transfer_data/Watson_MELA.CD8_T.h5ad")
adata_zhang = sc.read_h5ad("./transfer_data/Zhang_LC.CD8_T.h5ad")
merged_adata_for_transfer = sc.concat([adata_bassez_cohort1,
    adata_bassez_cohort2,
    adata_bi,
    adata_caushi,
    adata_liu,
    adata_luoma_pbmc,
    adata_luoma_til,
    adata_watson,
    adata_zhang
])
Transfer using pretrained models
Note
For training scAtlasVAE model you will need CUDA available.
Please see the PyTorch official website for installing GPU-enabled version of PyTorch.
## ALL SCRIPT
adata_transfer = sc.read_h5ad("../Merged_adata_for_transfer.3.h5ad")

state_dict = torch.load("./huARdb_v2_GEX.CD8.hvg4k.supervised.model")
adata_transfer.obs["cell_subtype_3"] = "undefined"
adata_transfer = adata_transfer[:, adata_cd8.var.index]
adata_transfer.obs["cell_subtype_3"] = pd.Categorical(
    list(adata_transfer.obs["cell_subtype_3"]),
    categories=pd.Categorical(adata_cd8.obs["cell_subtype_3"]).categories,
)


adata_transfer.obs["study_name"] = "Lechner_2023"
vae_model_transfer = scatlasvae.model.scAtlasVAE(
    adata=adata_transfer,
    pretrained_state_dict=state_dict["model_state_dict"],
    **state_dict["model_config"]
)

adata_transfer.obsm["X_gex"] = vae_model_transfer.get_latent_embedding()
adata_transfer.obsm["X_umap"] = scatlasvae.tl.transfer_umap(
    adata_cd8.obsm["X_gex"],
    adata_cd8.obsm["X_umap"],
    adata_transfer.obsm["X_gex"],
    method="knn",
    n_neighbors=3,
)["embedding"]
df = vae_model_transfer.predict_labels(return_pandas=True)
adata_transfer.obs["cell_subtype_3"] = list(df["cell_subtype_3"])

import torch

adata_transfer_tex = adata_transfer[
    list(map(lambda x: "Tex" in x, adata_transfer.obs["cell_subtype_3"]))
]
adata_transfer_tex.obs["cell_subtype_4"] = "undefined"
adata_transfer_tex.obs["cell_subtype_4"] = pd.Categorical(
    list(adata_transfer_tex.obs["cell_subtype_4"]),
    categories=adata_cd8_tex.obs["cell_subtype_4"].cat.categories,
)

state_dict = torch.load(
    "huARdb_v2_GEX.CD8.hvg4k.Tex.supervised.model"
)
vae_model_transfer = scatlasvae.model.scAtlasVAE(
    adata=adata_transfer_tex,
    pretrained_state_dict=state_dict["model_state_dict"],
    **state_dict["model_config"]
)

adata_transfer_tex.obsm["X_retrain_GEX"] = vae_model_transfer.get_latent_embedding()

adata_transfer_tex.obsm["X_retrain_umap"] = scatlasvae.tl.transfer_umap(
    adata_cd8_tex.obsm["X_retrain_GEX"],
    adata_cd8_tex.obsm["X_retrain_umap"],
    adata_transfer_tex.obsm["X_retrain_GEX"],
    method="knn",
    n_neighbors=3,
)["embedding"]

adata_transfer_tex.obs["cell_subtype_4"] = vae_model_transfer.predict_labels(
    return_pandas=True
)["cell_subtype_4"]
fig,ax=createFig(figsize=(5,5))
obsm = adata_cd8.obsm['X_umap']
obsm = obsm[np.random.choice(list(range(len(adata_cd8))), 100000, replace=False)]
ax.scatter(
        obsm[:,0],
        obsm[:,1],
        lw=0,
        c='#A7A7A7',
        s=0.1,
        alpha=0.5
)
sc.pl.umap(adata_transfer, color='cell_subtype_3', ax=ax, palette=subtype_color, layer='normalized')
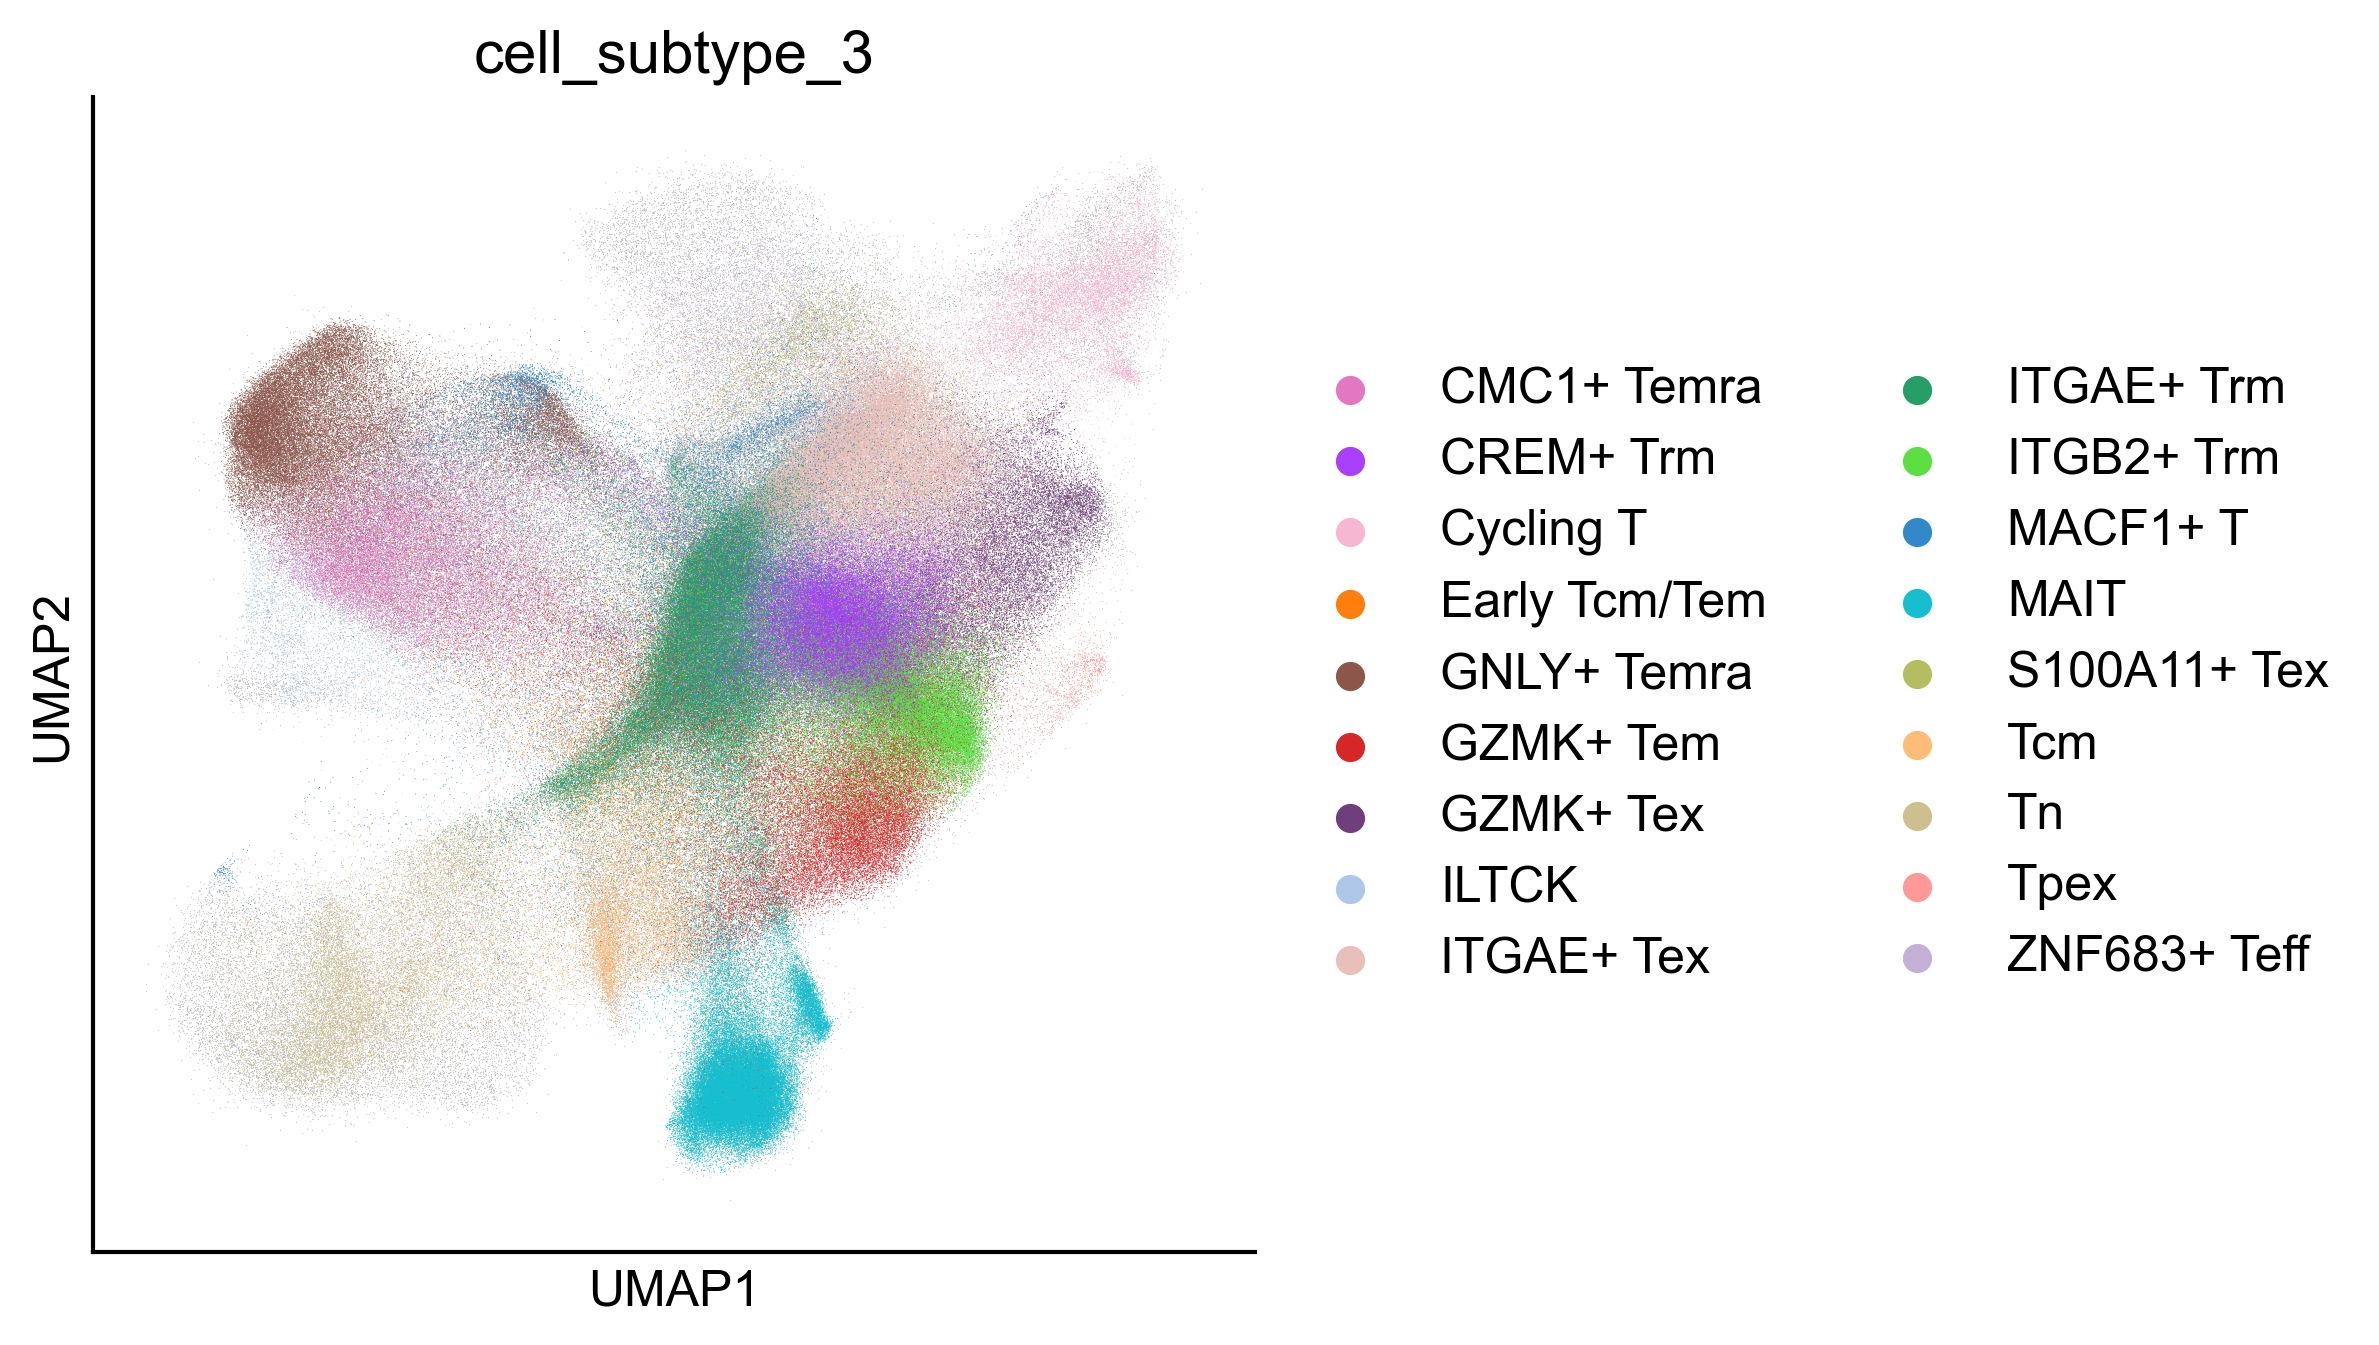
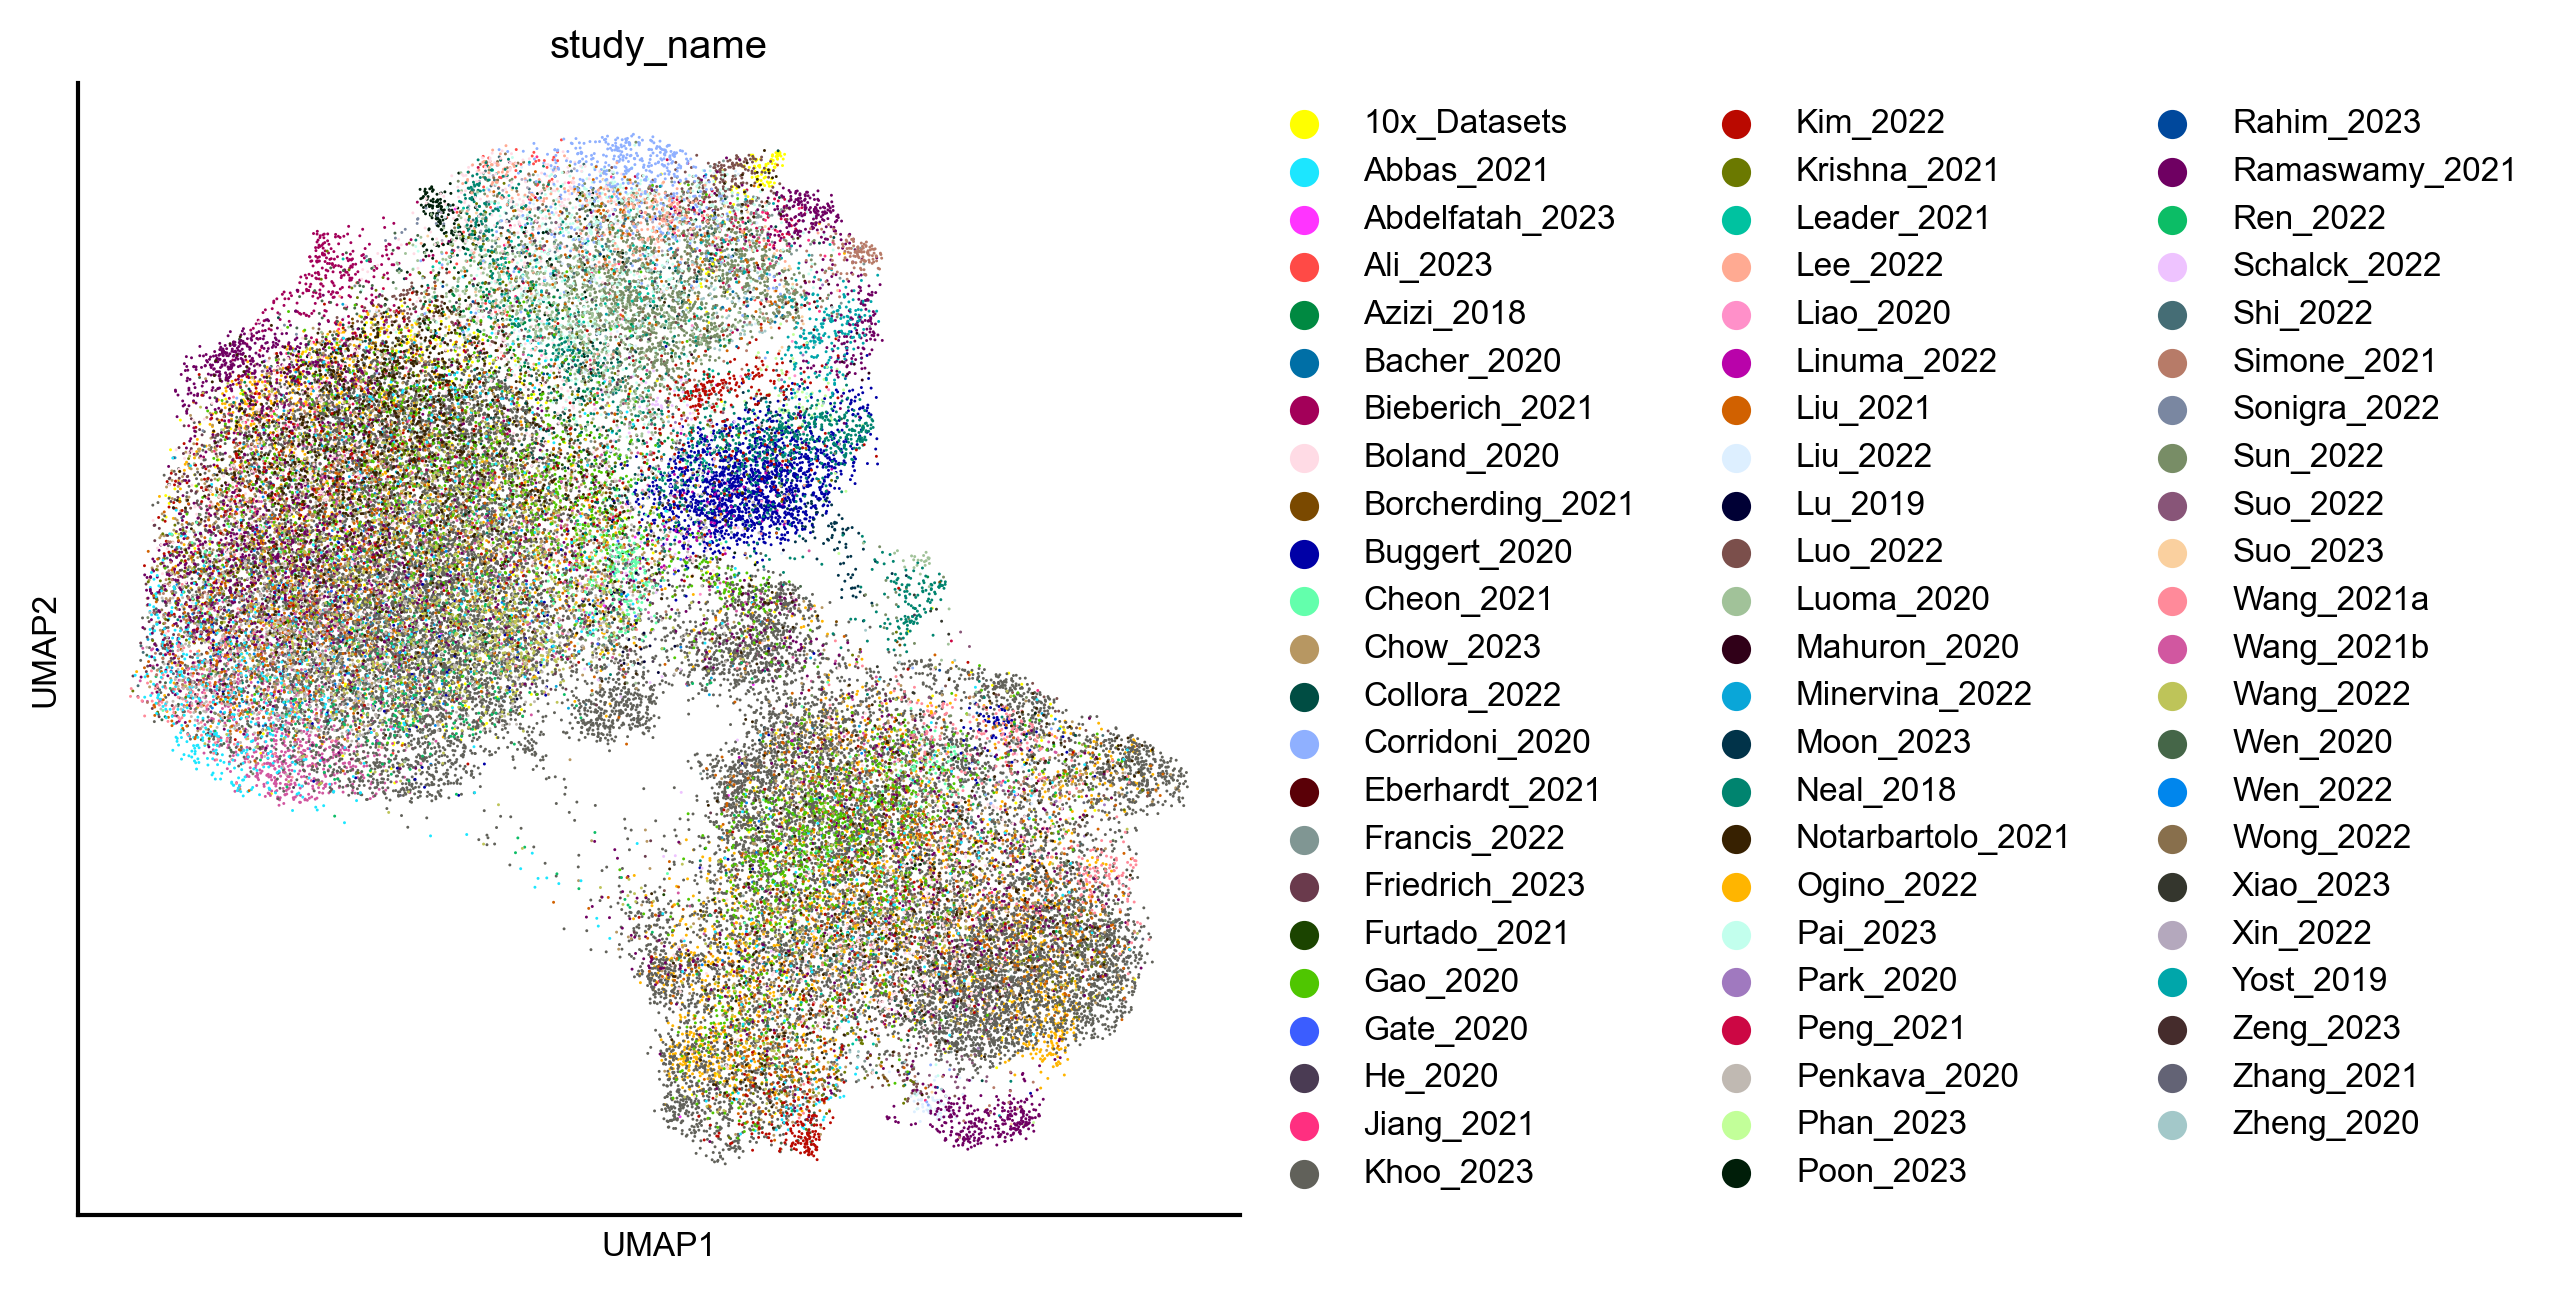
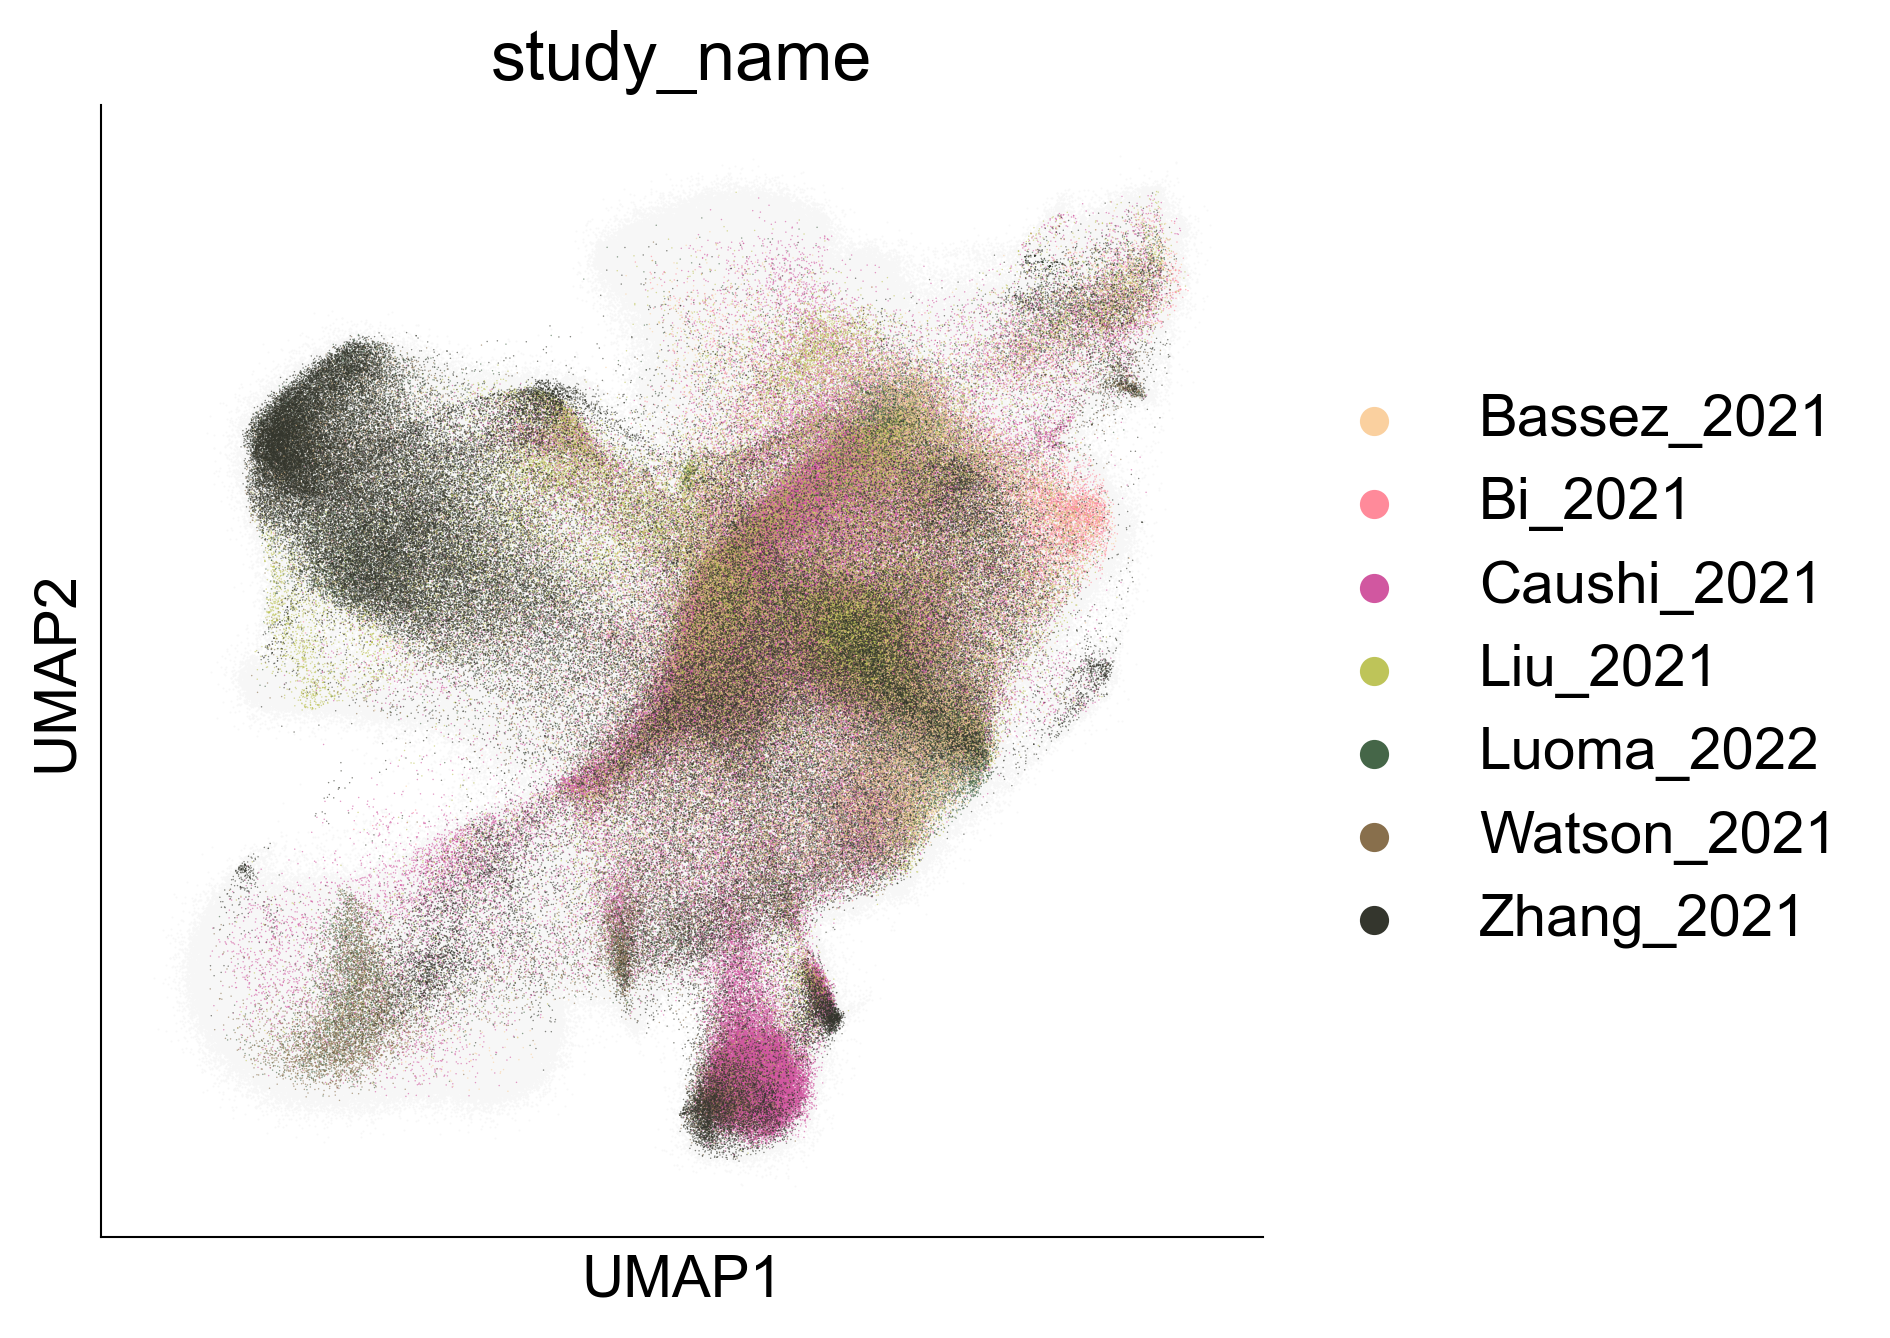
Figure 5A
fig, ax = createFig(figsize=(5, 5))
ax.scatter(obsm[:, 0], obsm[:, 1], lw=0, s=0.2, color="#F7F7F7")
sc.pl.umap(
    merged_adata_for_transfer[
        merged_adata_for_transfer.obs["study_name"] != "Smillie_2019"
    ],
    color="study_name",
    # palette=subtype_color,
    palette=sc.pl.palettes.godsnot_102[56:61] + sc.pl.palettes.godsnot_102[62:],
    ax=ax,
    s=0.5,
    alpha=0.6,
)
fig.savefig("./figures/merged_adata_for_transfer.zero_shot_transfer.cell_subtype_3.png")
/usr/local/lib/python3.9/site-packages/anndata/compat/_overloaded_dict.py:106: ImplicitModificationWarning: Trying to modify attribute `._uns` of view, initializing view as actual.
  self.data[key] = value
/usr/local/lib/python3.9/site-packages/anndata/_core/anndata.py:1828: UserWarning: Observation names are not unique. To make them unique, call `.obs_names_make_unique`.
  utils.warn_names_duplicates("obs")
/usr/local/lib/python3.9/site-packages/scanpy/plotting/_tools/scatterplots.py:394: UserWarning: No data for colormapping provided via 'c'. Parameters 'cmap' will be ignored
  cax = scatter(
fig, ax = createFig(figsize=(5, 5))
sc.pl.embedding(
    adata_transfer_tex, color="cell_subtype_4", ax=ax, basis="X_retrain_umap"
)
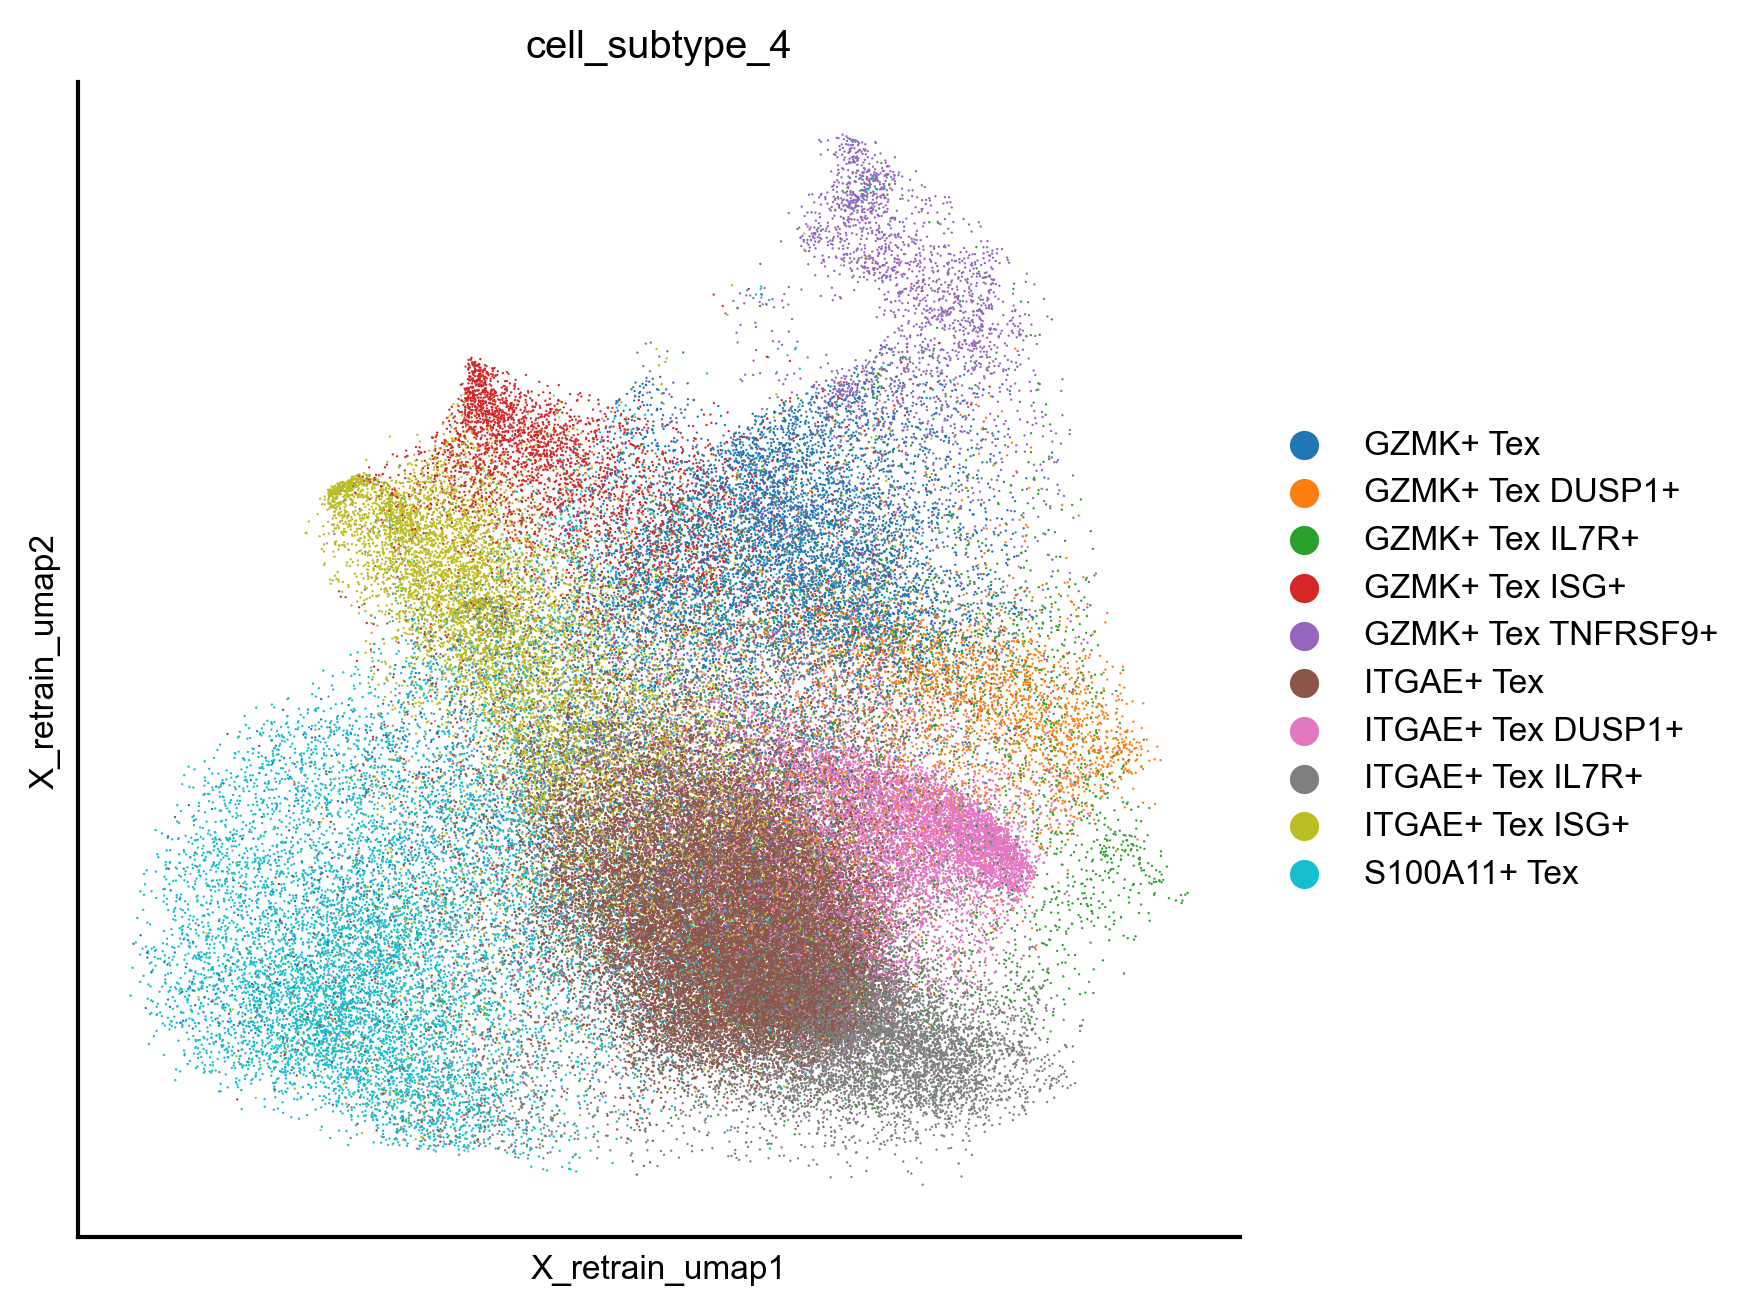
Figure 5B
sc.pl.dotplot(
    merged_adata_for_transfer,
    var_names=[
        "S1PR1",
        "LEF1",
        "SELL",
        "IL7R",
        "KLRG1",
        "GZMK",
        "GZMB",
        "GNLY",
        "ZNF683",
        "KLRB1",
        "ZBTB16",
        "FCER1G",
        "TYROBP",
        "CMC1",
        "ITGAE",
        "CREM",
        "TCF7",
        "PDCD1",
        "LAG3",
        "HAVCR2",
        "CXCR6",
        "TIGIT",
        "XBP1",
        "MACF1",
        "MKI67",
        "CDC20",
    ],
    groupby="cell_subtype_3",
    dot_max=0.7,
    standard_scale="var",
    layer="normalized",
    save="20231220_Merged_adata_for_transfer.zero_shot_transfer",
)
WARNING: saving figure to file figures/dotplot_20231220_Merged_adata_for_transfer.zero_shot_transfer.pdf
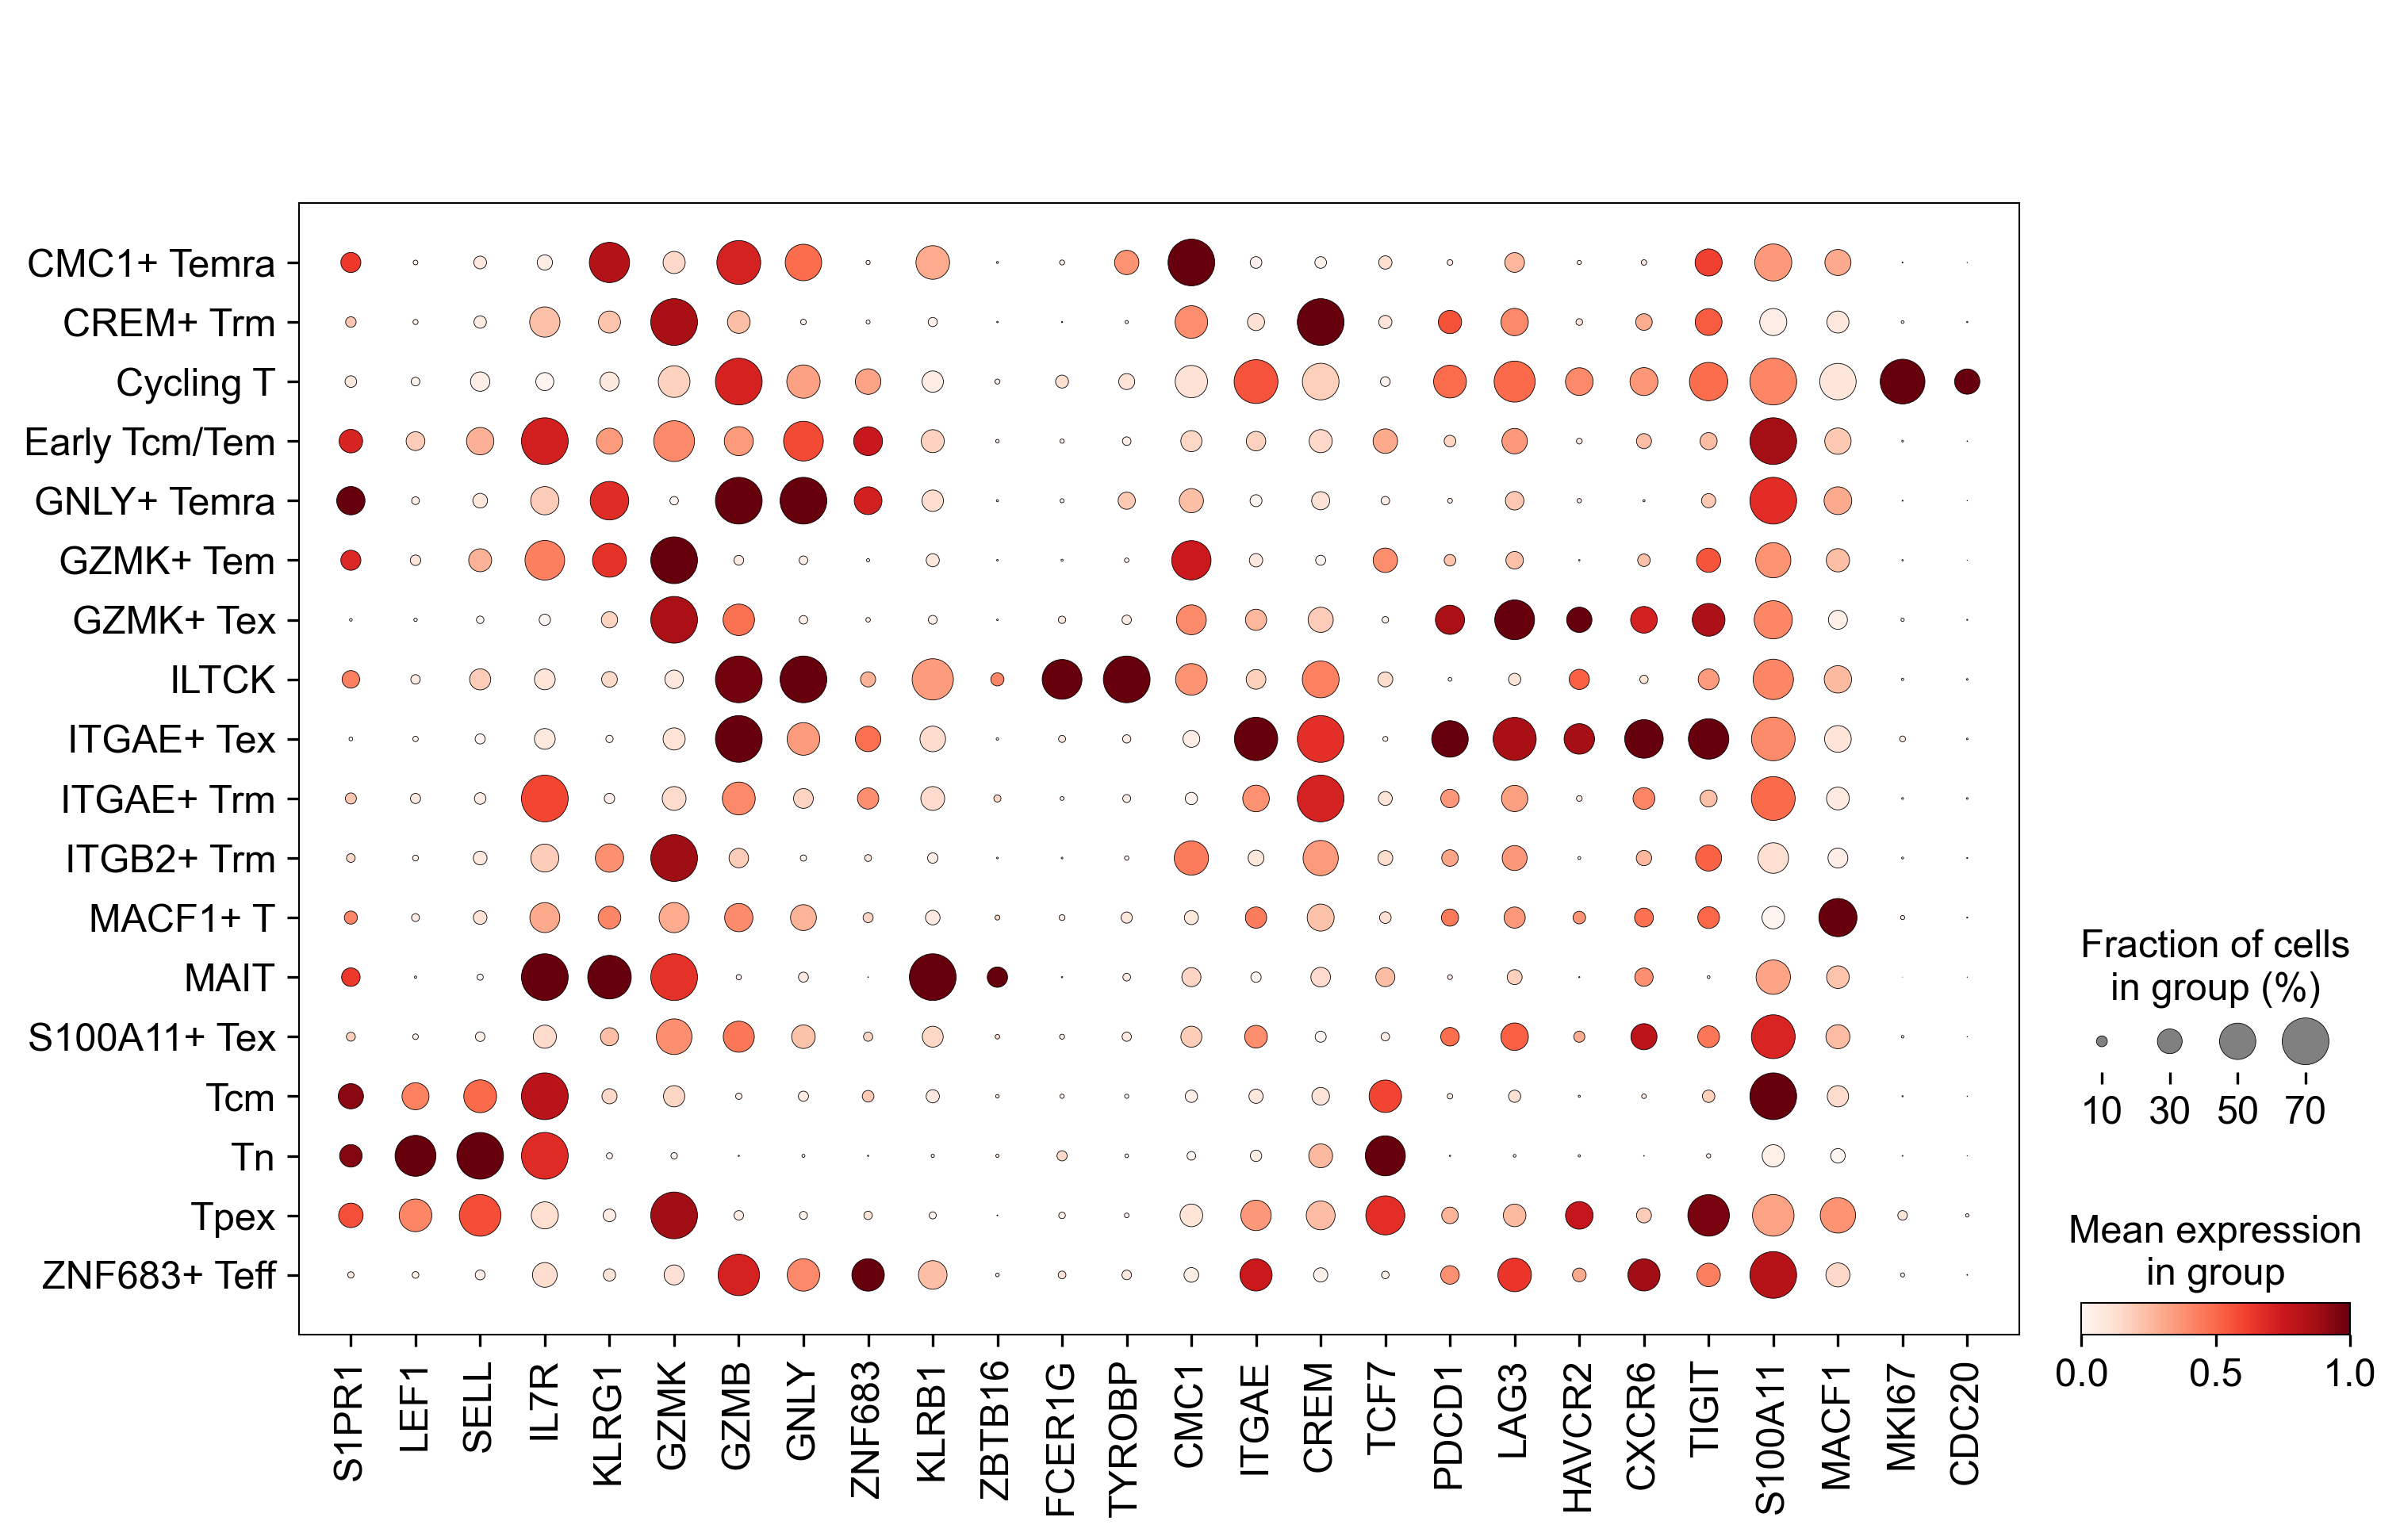
Figure 5C
fig, axes = createSubplots(3, 3, figsize=(10, 10))
axes = axes.flatten()
for ax in axes:
    ax.scatter(obsm[:, 0], obsm[:, 1], lw=0, s=0.2, color="#F7F7F7")

sc.pl.umap(
    merged_adata_for_transfer[
        np.array(merged_adata_for_transfer.obs["study_name"] == "Watson_2021")
        & np.array(merged_adata_for_transfer.obs["tissue_type"] == "PBMC")
    ],
    color="cell_subtype_3",
    palette=subtype_color,
    show=False,
    ax=axes[0],
    s=3,
    legend_loc="none",
)


sc.pl.umap(
    merged_adata_for_transfer[
        np.array(merged_adata_for_transfer.obs["study_name"] == "Luoma_2022")
        & np.array(merged_adata_for_transfer.obs["tissue_type"] == "PBMC")
    ],
    color="cell_subtype_3",
    palette=subtype_color,
    ax=axes[1],
    s=3,
    alpha=0.6,
    show=False,
    legend_loc="none",
)

sc.pl.umap(
    merged_adata_for_transfer[
        np.array(merged_adata_for_transfer.obs["study_name"] == "Zhang_2021")
        & np.array(merged_adata_for_transfer.obs["tissue_type"] == "PBMC")
    ],
    color="cell_subtype_3",
    palette=subtype_color,
    ax=axes[2],
    s=3,
    alpha=0.6,
    show=False,
    legend_loc="none",
)


sc.pl.umap(
    merged_adata_for_transfer[
        np.array(merged_adata_for_transfer.obs["study_name"] == "Bassez_2021")
        & np.array(merged_adata_for_transfer.obs["tissue_type"] == "TIL")
    ],
    color="cell_subtype_3",
    palette=subtype_color,
    show=False,
    ax=axes[3],
    s=3,
    alpha=0.6,
    legend_loc="none",
)


sc.pl.umap(
    merged_adata_for_transfer[
        np.array(merged_adata_for_transfer.obs["study_name"] == "Luoma_2022")
        & np.array(merged_adata_for_transfer.obs["tissue_type"] == "TIL")
    ],
    color="cell_subtype_3",
    palette=subtype_color,
    ax=axes[4],
    s=3,
    alpha=0.6,
    show=False,
    legend_loc="none",
)

sc.pl.umap(
    merged_adata_for_transfer[
        np.array(merged_adata_for_transfer.obs["study_name"] == "Liu_2021")
        & np.array(merged_adata_for_transfer.obs["tissue_type"] == "TIL")
    ],
    color="cell_subtype_3",
    palette=subtype_color,
    ax=axes[5],
    s=3,
    alpha=0.6,
    show=False,
    legend_loc="none",
)

sc.pl.umap(
    merged_adata_for_transfer[
        np.array(merged_adata_for_transfer.obs["study_name"] == "Zhang_2021")
        & np.array(merged_adata_for_transfer.obs["tissue_type"] == "TIL")
    ],
    color="cell_subtype_3",
    palette=subtype_color,
    ax=axes[6],
    s=3,
    alpha=0.6,
    show=False,
    legend_loc="none",
)

sc.pl.umap(
    merged_adata_for_transfer[
        np.array(merged_adata_for_transfer.obs["study_name"] == "Caushi_2021")
        & np.array(merged_adata_for_transfer.obs["tissue_type"] == "TIL")
    ],
    color="cell_subtype_3",
    palette=subtype_color,
    ax=axes[7],
    s=3,
    alpha=0.6,
    show=False,
    legend_loc="none",
)

plt.show()
/usr/local/lib/python3.9/site-packages/anndata/compat/_overloaded_dict.py:106: ImplicitModificationWarning: Trying to modify attribute `._uns` of view, initializing view as actual.
  self.data[key] = value
/usr/local/lib/python3.9/site-packages/scanpy/plotting/_tools/scatterplots.py:394: UserWarning: No data for colormapping provided via 'c'. Parameters 'cmap' will be ignored
  cax = scatter(
/usr/local/lib/python3.9/site-packages/anndata/compat/_overloaded_dict.py:106: ImplicitModificationWarning: Trying to modify attribute `._uns` of view, initializing view as actual.
  self.data[key] = value
/usr/local/lib/python3.9/site-packages/anndata/_core/anndata.py:1828: UserWarning: Observation names are not unique. To make them unique, call `.obs_names_make_unique`.
  utils.warn_names_duplicates("obs")
/usr/local/lib/python3.9/site-packages/scanpy/plotting/_tools/scatterplots.py:394: UserWarning: No data for colormapping provided via 'c'. Parameters 'cmap' will be ignored
  cax = scatter(
<Figure size 1800x1200 with 0 Axes>
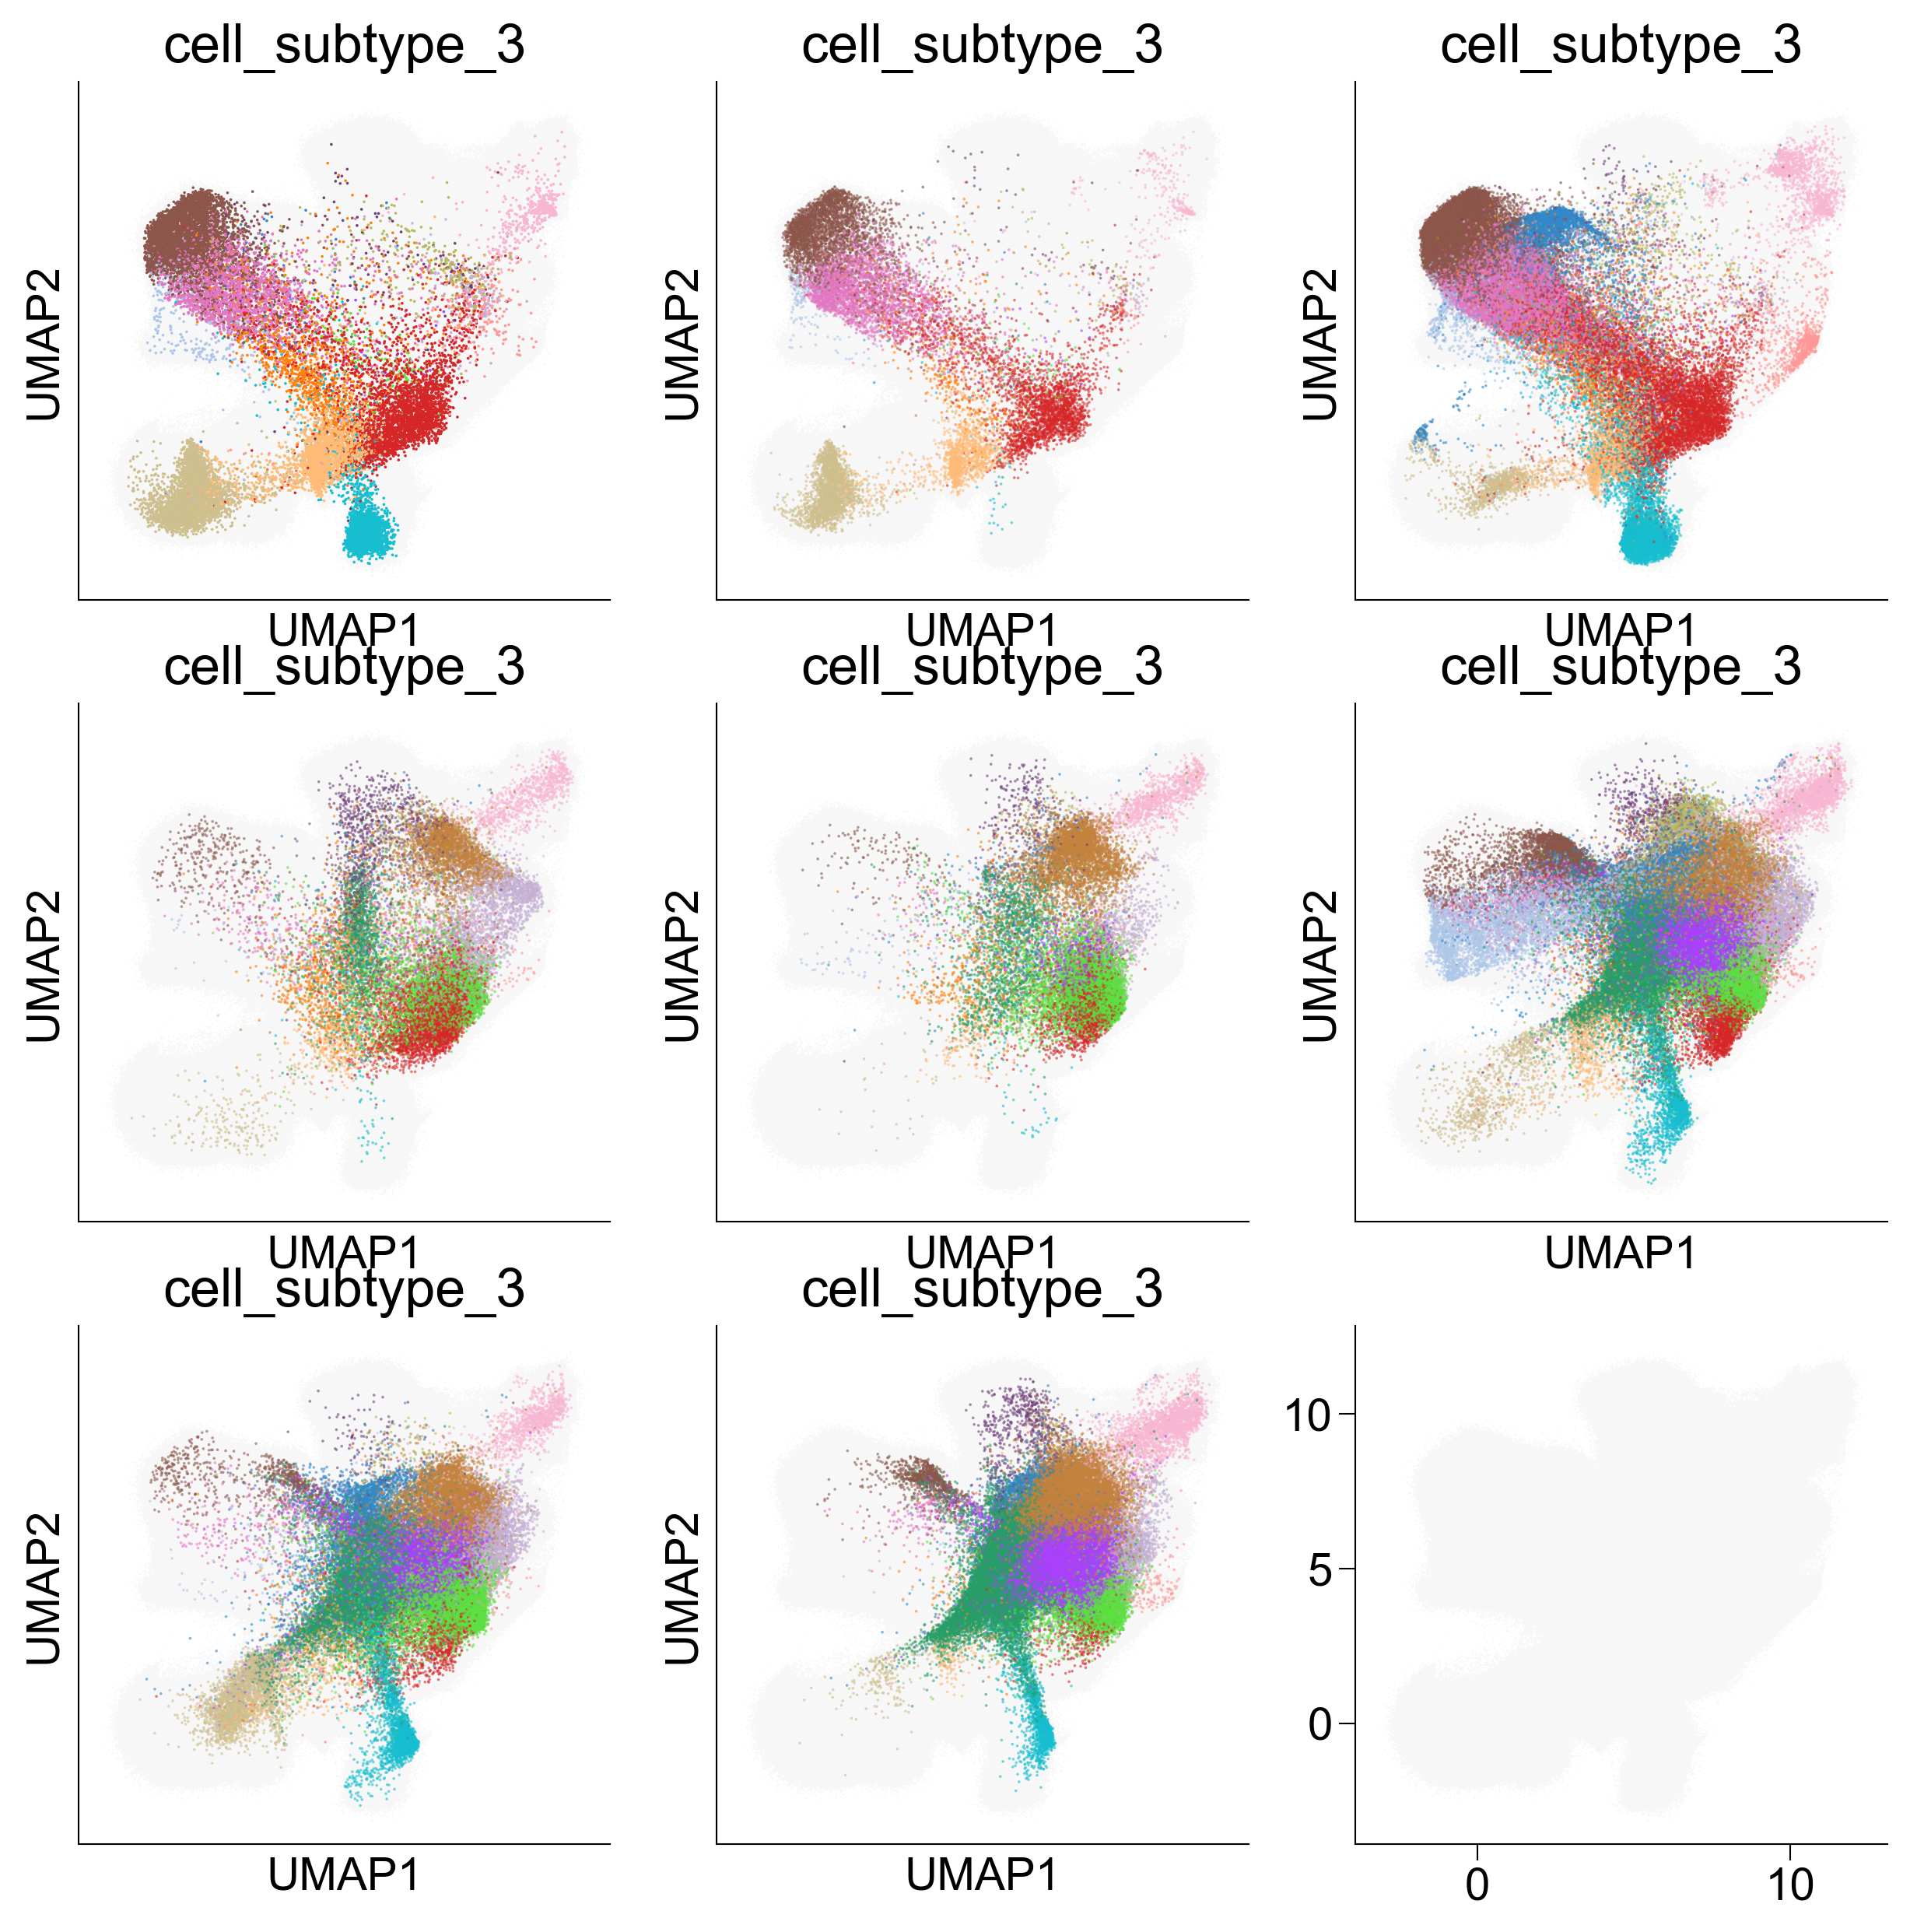
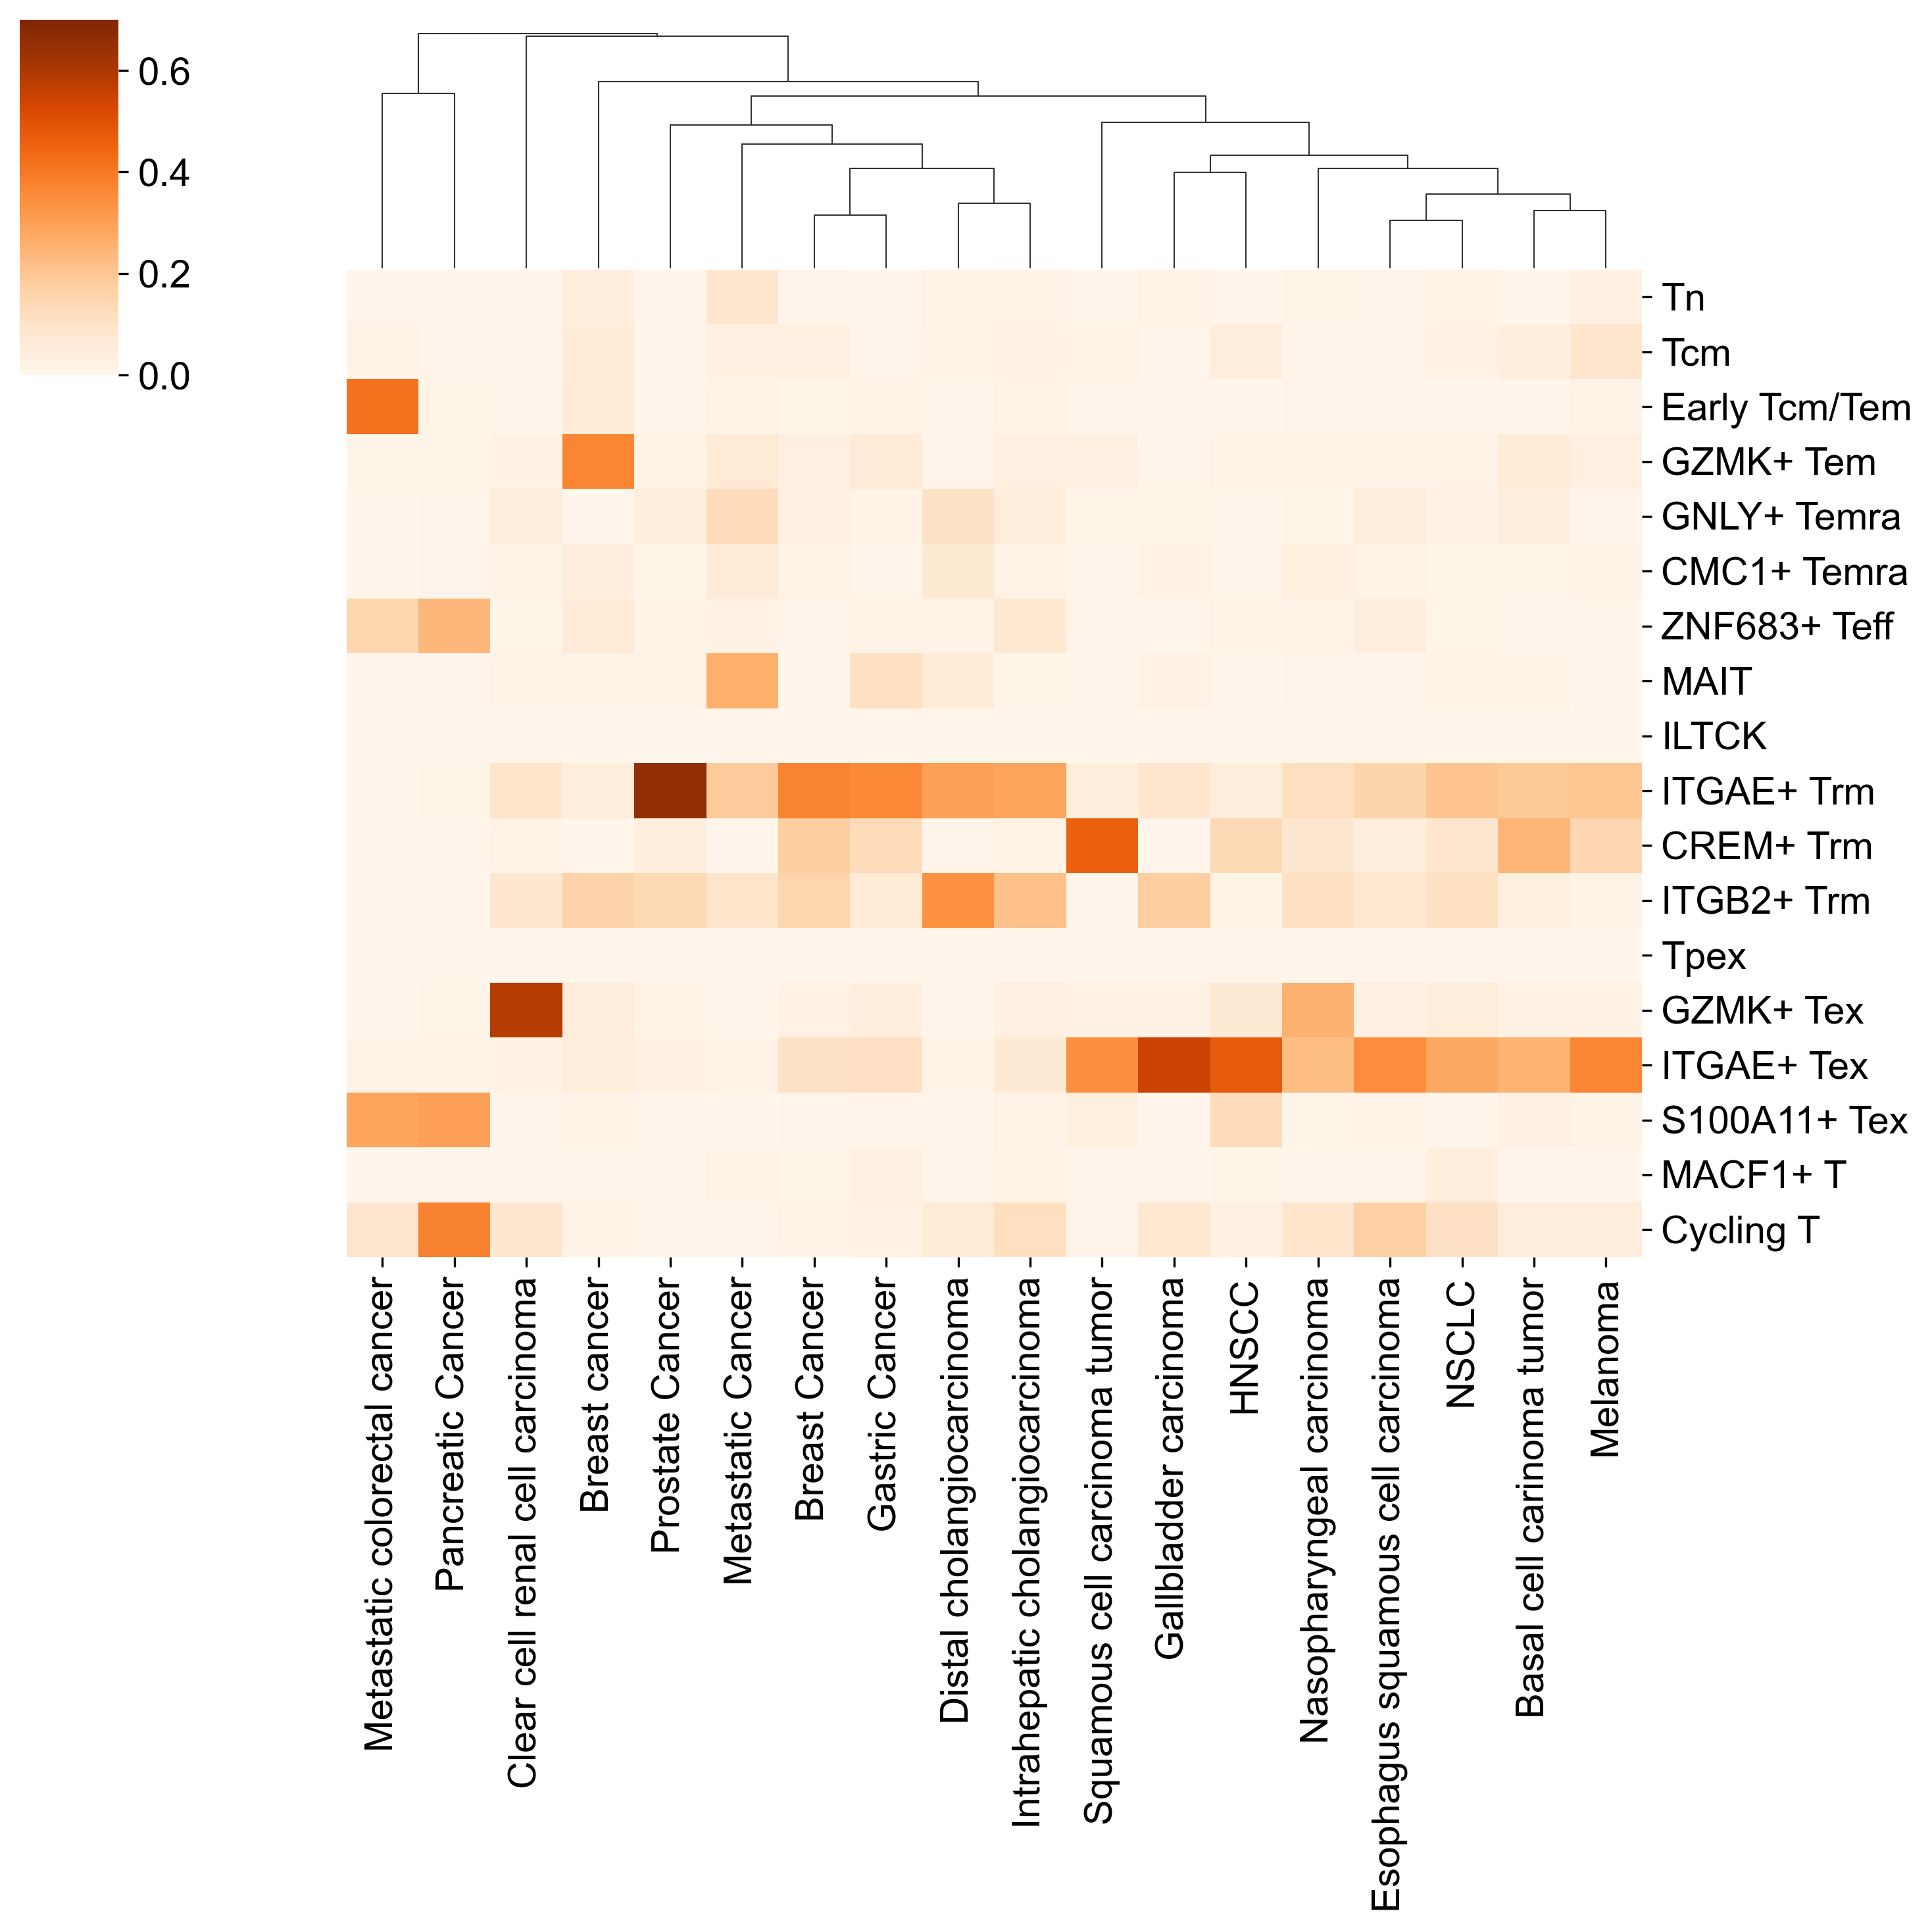
Figure 5D
fraction, _ = plot_a_by_b(
    adata_cd8[
        np.array(adata_cd8.obs["disease_meta_type"] == "Solid tumor")
        & np.array(adata_cd8.obs["tissue_meta_type"] == "TIL")
    ],
    a="cell_subtype_3",
    b="disease",
)
plt.close()
fraction.index = list(fraction.iloc[:, 0])
fraction = fraction.iloc[:, 1:]
sns.clustermap(
    fraction.T.loc[
        [
            "Tn",
            "Tcm",
            "Early Tcm/Tem",
            "GZMK+ Tem",
            "GNLY+ Temra",
            "CMC1+ Temra",
            "ZNF683+ Teff",
            "MAIT",
            "ILTCK",
            "ITGAE+ Trm",
            "CREM+ Trm",
            "ITGB2+ Trm",
            "Tpex",
            "GZMK+ Tex",
            "ITGAE+ Tex",
            "S100A11+ Tex",
            "MACF1+ T",
            "Cycling T",
        ]
    ],
    cmap="Oranges",
    xticklabels=1,
    yticklabels=1,
    vmax=0.7,
    row_cluster=False,
)
plt.savefig("./figures/reference_dataset_solid_tumor_TIL.pdf")
_merged_adata_for_transfer = merged_adata_for_transfer[
    np.array(merged_adata_for_transfer.obs["tissue_type"] == "PBMC")
]
_merged_adata_for_transfer.obs["disease_treatment"] = list(
    map(
        lambda x: str(x[0]) + "-" + "Pre"
        if "naive" in x[1]
        else str(x[0]) + "-" + "Post",
        zip(
            _merged_adata_for_transfer.obs["disease_type"],
            _merged_adata_for_transfer.obs["treatment"],
        ),
    )
)
# sc.pl.umap(_merged_adata_for_transfer, color='cell_subtype_3', palette=subtype_color)


fraction, _ = plot_a_by_b(
    _merged_adata_for_transfer, a="cell_subtype_3", b="disease_treatment"
)
plt.close()
fraction.index = list(fraction.iloc[:, 0])
fraction = fraction.iloc[:, 1:]
sns.heatmap(
    fraction.T.loc[
        [
            "Tn",
            "Tcm",
            "Early Tcm/Tem",
            "GZMK+ Tem",
            "GNLY+ Temra",
            "CMC1+ Temra",
            "ZNF683+ Teff",
            "MAIT",
            "ILTCK",
            "ITGAE+ Trm",
            "CREM+ Trm",
            "ITGB2+ Trm",
            "Tpex",
            "GZMK+ Tex",
            "ITGAE+ Tex",
            "S100A11+ Tex",
            "MACF1+ T",
            "Cycling T",
        ]
    ],
    cmap="Blues",
    xticklabels=1,
    yticklabels=1,
    vmax=0.5,
)

plt.savefig("./figures/transfered_dataset_solid_tumor_pbmc.pdf")
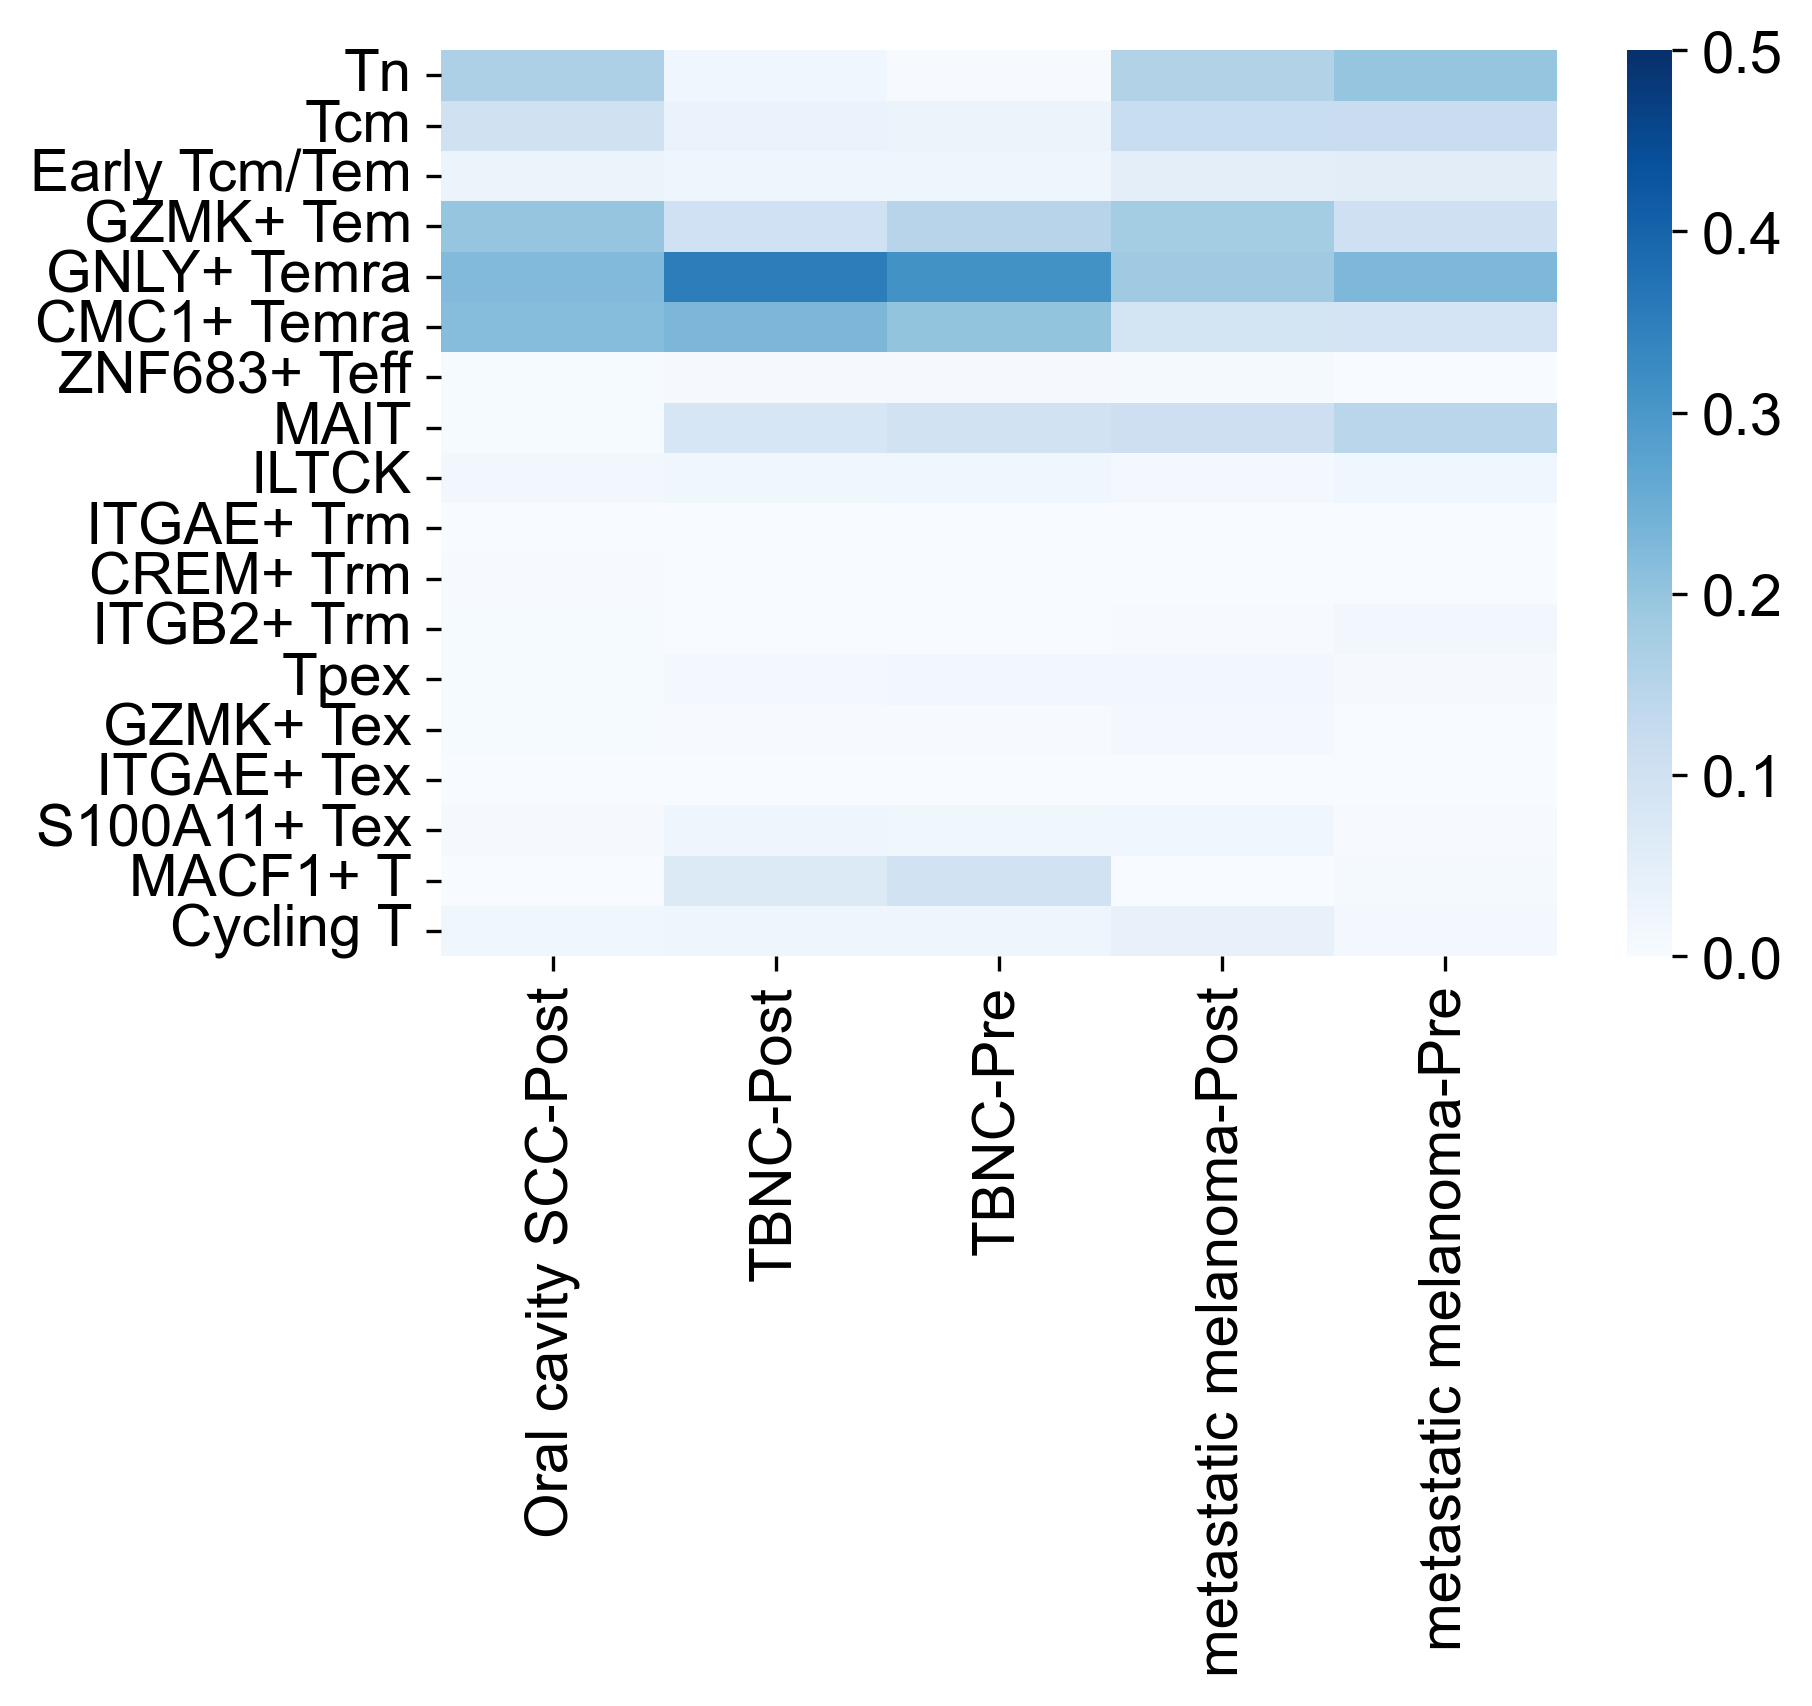
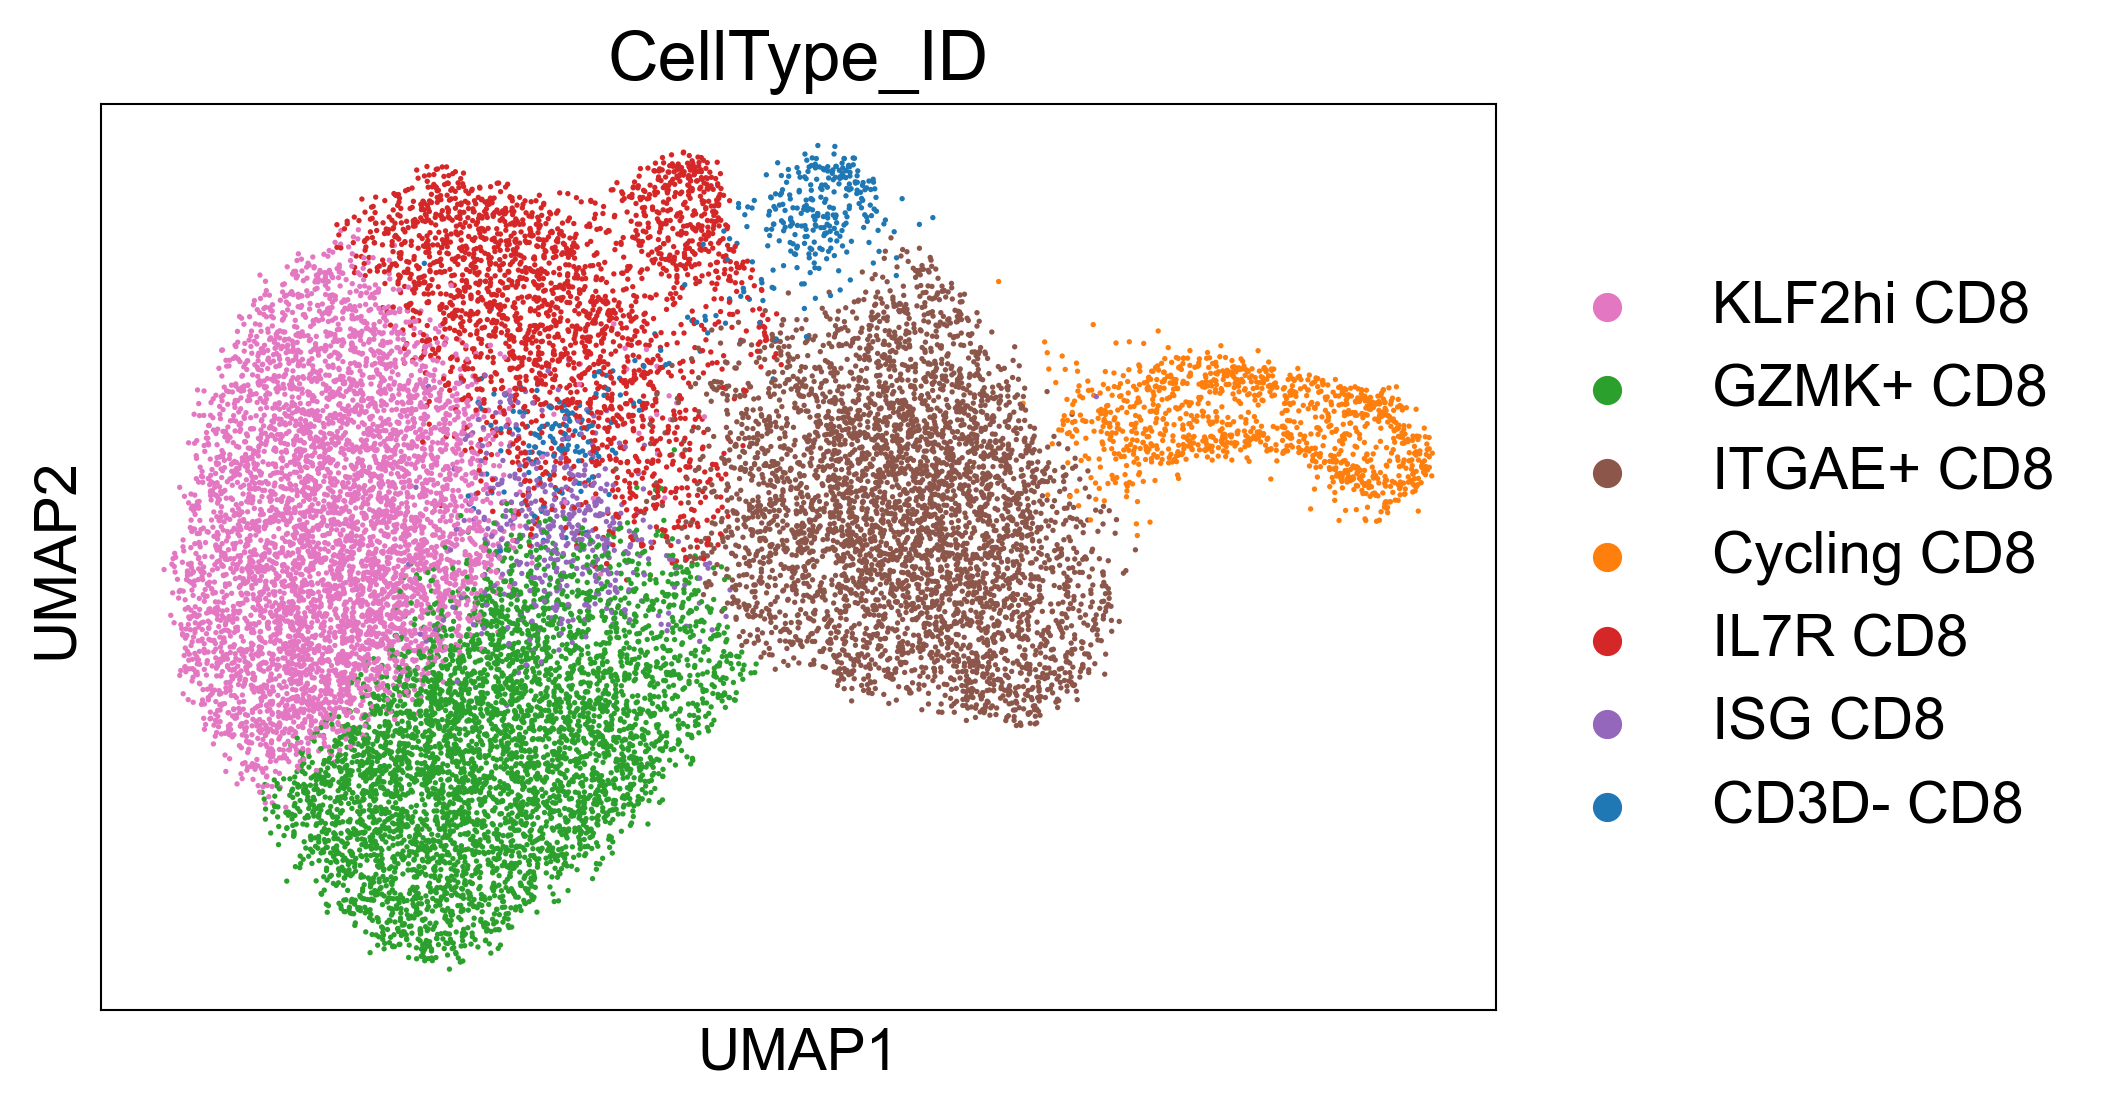
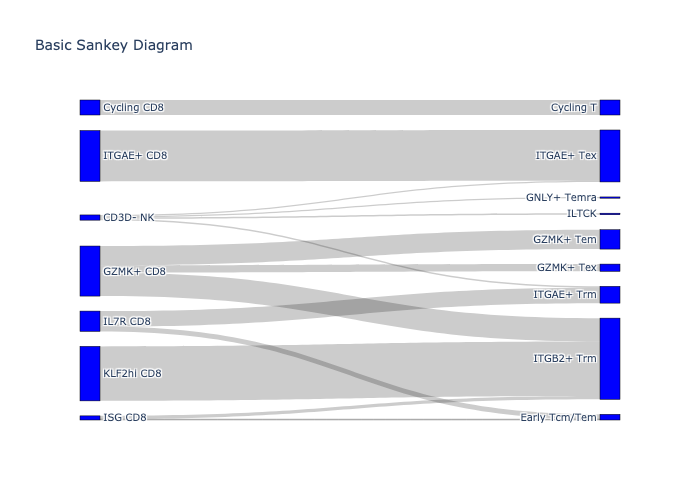
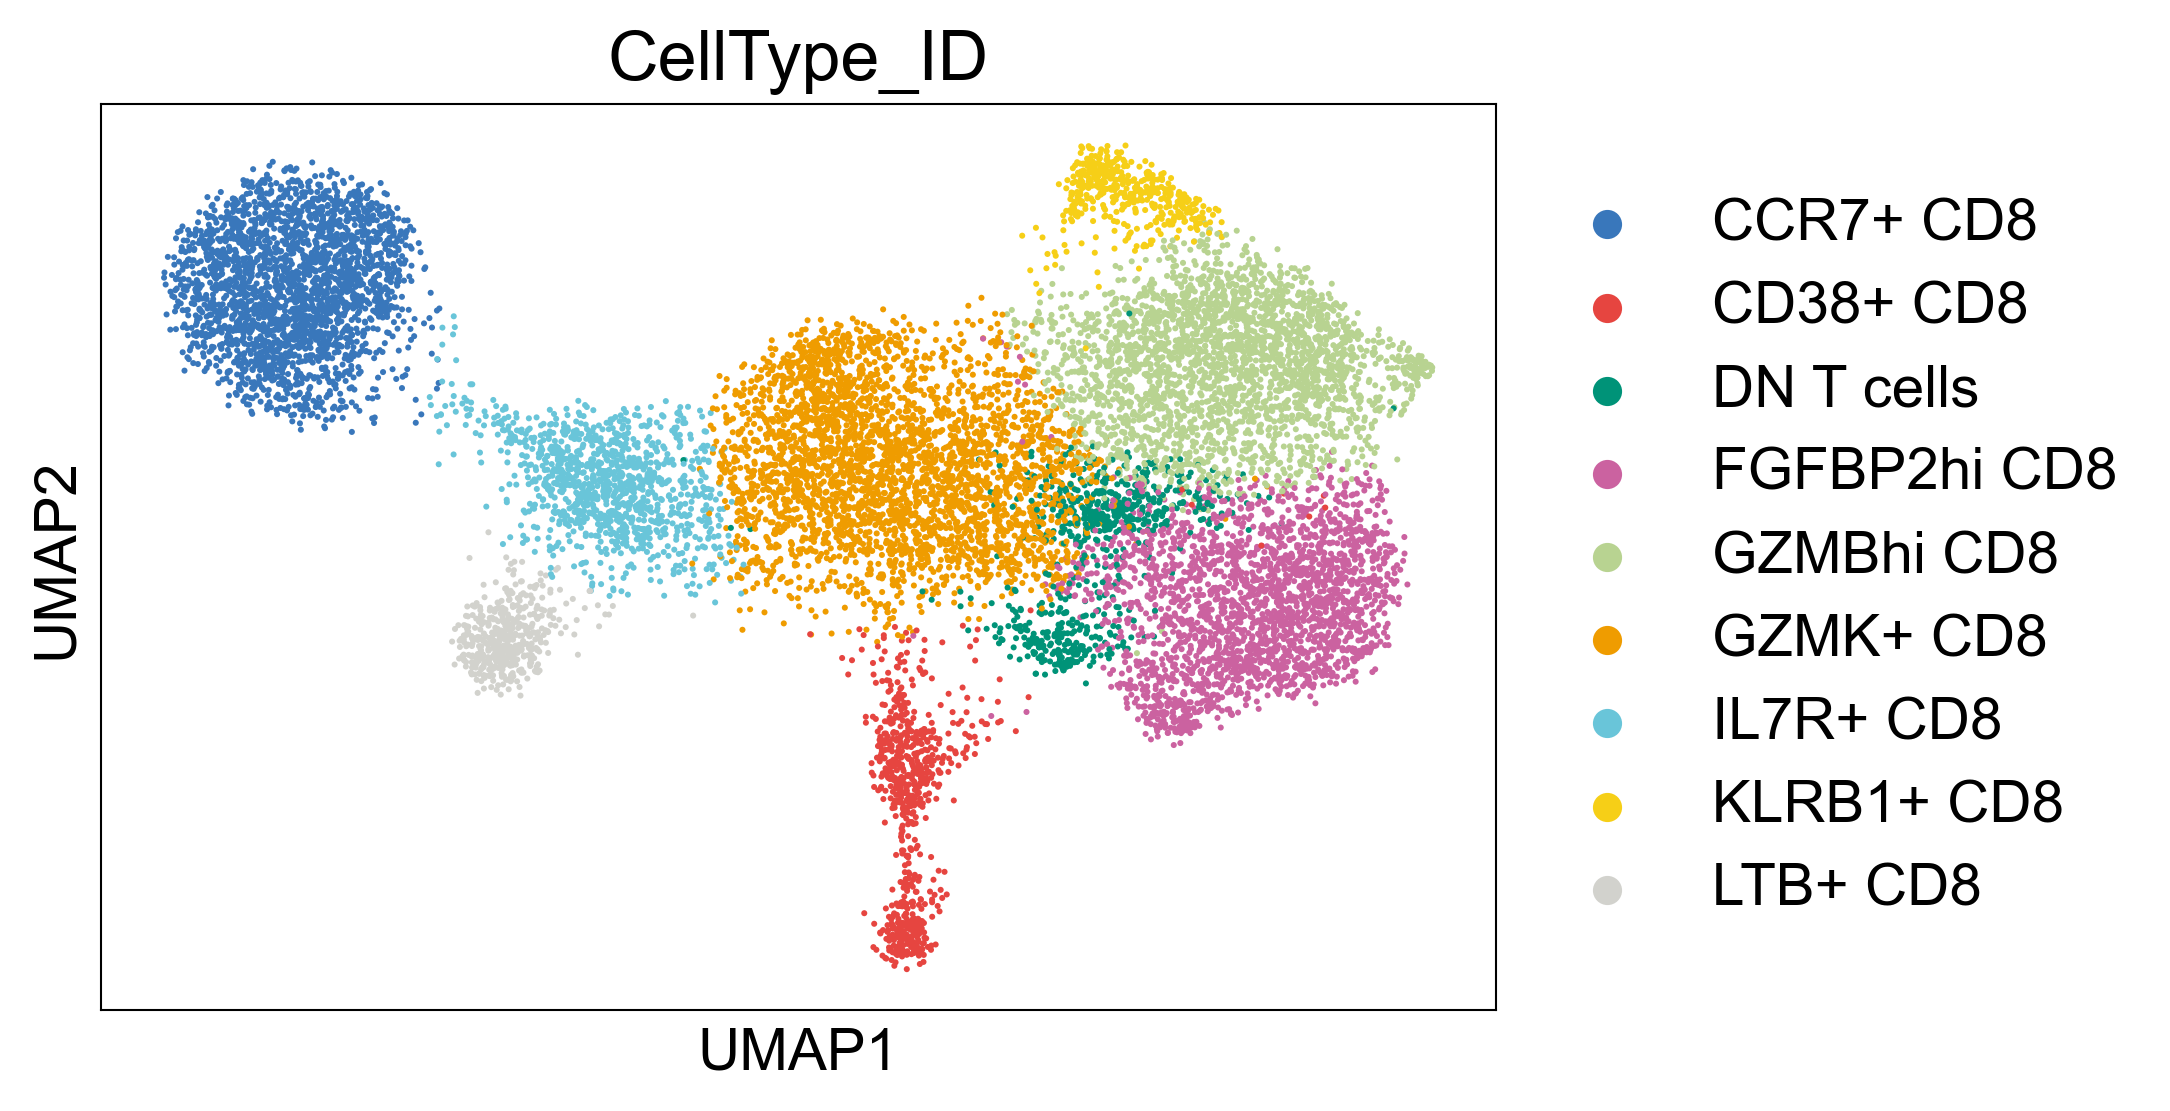
Extended Data Fig 12
adata_luoma_til = sc.read_h5ad("./data/transfer_data/Luoma_2022_merged_TIL_CD8.h5ad")
sc.pl.umap(adata_luoma_til, color='CellType_ID',palette=dict(zip([
    'CD3D- CD8',
    'Cycling CD8',
    'GZMK+ CD8',
    'IL7R CD8',
    'ISG CD8',
    'ITGAE+ CD8',
    'KLF2hi CD8'], default_10)))
/usr/local/lib/python3.9/site-packages/scanpy/plotting/_tools/scatterplots.py:394: UserWarning: No data for colormapping provided via 'c'. Parameters 'cmap' will be ignored
  cax = scatter(
count, fig = scatlasvae.tl.cell_type_alignment(
    adata_luoma_til, obs_1="CellType_ID", obs_2="cell_subtype_3"
)
fig.show(renderer="png")
adata_luoma_2 = sc.read_h5ad("./data/transfer_data/Luoma_2022_merged_PBMC_CD8.h5ad")
sc.pl.umap(adata_luoma_2, color='CellType_ID', palette={
   'CCR7+ CD8': '#3977BB',
   'CD38+ CD8': '#E64540',
   'DN T cells': '#009378',
   'FGFBP2hi CD8': '#CB62A0',
   'GZMBhi CD8': '#B8D391',
   'GZMK+ CD8': '#EF9C00',
   'IL7R+ CD8': '#69C5D9',
   'KLRB1+ CD8': '#F6CF17',
   'LTB+ CD8': '#D2D2CD'
})
/usr/local/lib/python3.9/site-packages/scanpy/plotting/_tools/scatterplots.py:394: UserWarning: No data for colormapping provided via 'c'. Parameters 'cmap' will be ignored
  cax = scatter(
count, fig = scatlasvae.tl.cell_type_alignment(
    adata_watson, obs_1="orig.ident", obs_2="cell_subtype_3"
)
fig.show(renderer="png")
Map Zheng et al., 2021 atlas to pan-disease CD8 T atlas Tex subset
Note
For training scAtlasVAE model you will need CUDA available.
Please see the PyTorch official website for installing GPU-enabled version of PyTorch.
adata_cd8_zheng_2021_tex_tpex.obs['cell_subtype_4'] = 'undefined'
adata_cd8_zheng_2021_tex_tpex.obs['cell_subtype_4'] = pd.Categorical(
    list(adata_cd8_zheng_2021_tex_tpex.obs['cell_subtype_4']),
    categories=adata_cd8_tex.obs['cell_subtype_4'].cat.categories
)
import torch
state_dict = torch.load(
    "/rsch/Snowxue/2023-NM-Revision-GEX-HuARdb-Notebooks/20231210Tex.retrain_vae_for_transfer.model"
)
vae_model_transfer = scatlasvae.model.scAtlasVAE(
    adata=adata_cd8_zheng_2021_tex_tpex,
    pretrained_state_dict=state_dict['model_state_dict'],
    **state_dict['model_config']
)

df = vae_model_transfer.predict_labels(return_pandas=True)

adata_cd8_zheng_2021_tex_tpex.obsm['X_retrain_GEX'] = vae_model_transfer.get_latent_embedding()
adata_cd8_zheng_2021_tex_tpex.obsm['X_retrain_umap'] = scatlasvae.tl.transfer_umap(
    adata_cd8_tex.obsm['X_retrain_GEX'],
    adata_cd8_tex.obsm['X_retrain_umap'],
    adata_cd8_zheng_2021_tex_tpex.obsm['X_retrain_GEX'],
    method='knn'
)['embedding']
Extended Data Figure 10h
fig,ax=createFig(figsize=(5,5))
sc.pl.embedding(adata_cd8_zheng_2021_tex_tpex, basis='X_retrain_umap', color='cell_subtype_4', cmap='Reds', layer='normalized', s=1, palette={
        'GZMK+ Tex':'#C5B0D5',
        'GZMK+ Tex DUSP1+': '#B6D373',
        'GZMK+ Tex IL7R+': '#00B4DA',
        'GZMK+ Tex ISG+': '#D5006F',
        'GZMK+ Tex TNFRSF9+': '#9500A3',
        'ITGAE+ Tex':'#C3823E',
        'ITGAE+ Tex DUSP1+': '#1A7C00',
        'ITGAE+ Tex IL7R+': '#0065DA',
        'ITGAE+ Tex ISG+': '#D51A00',
        'S100A11+ Tex':'#b5bd61',
    },    ax=ax)
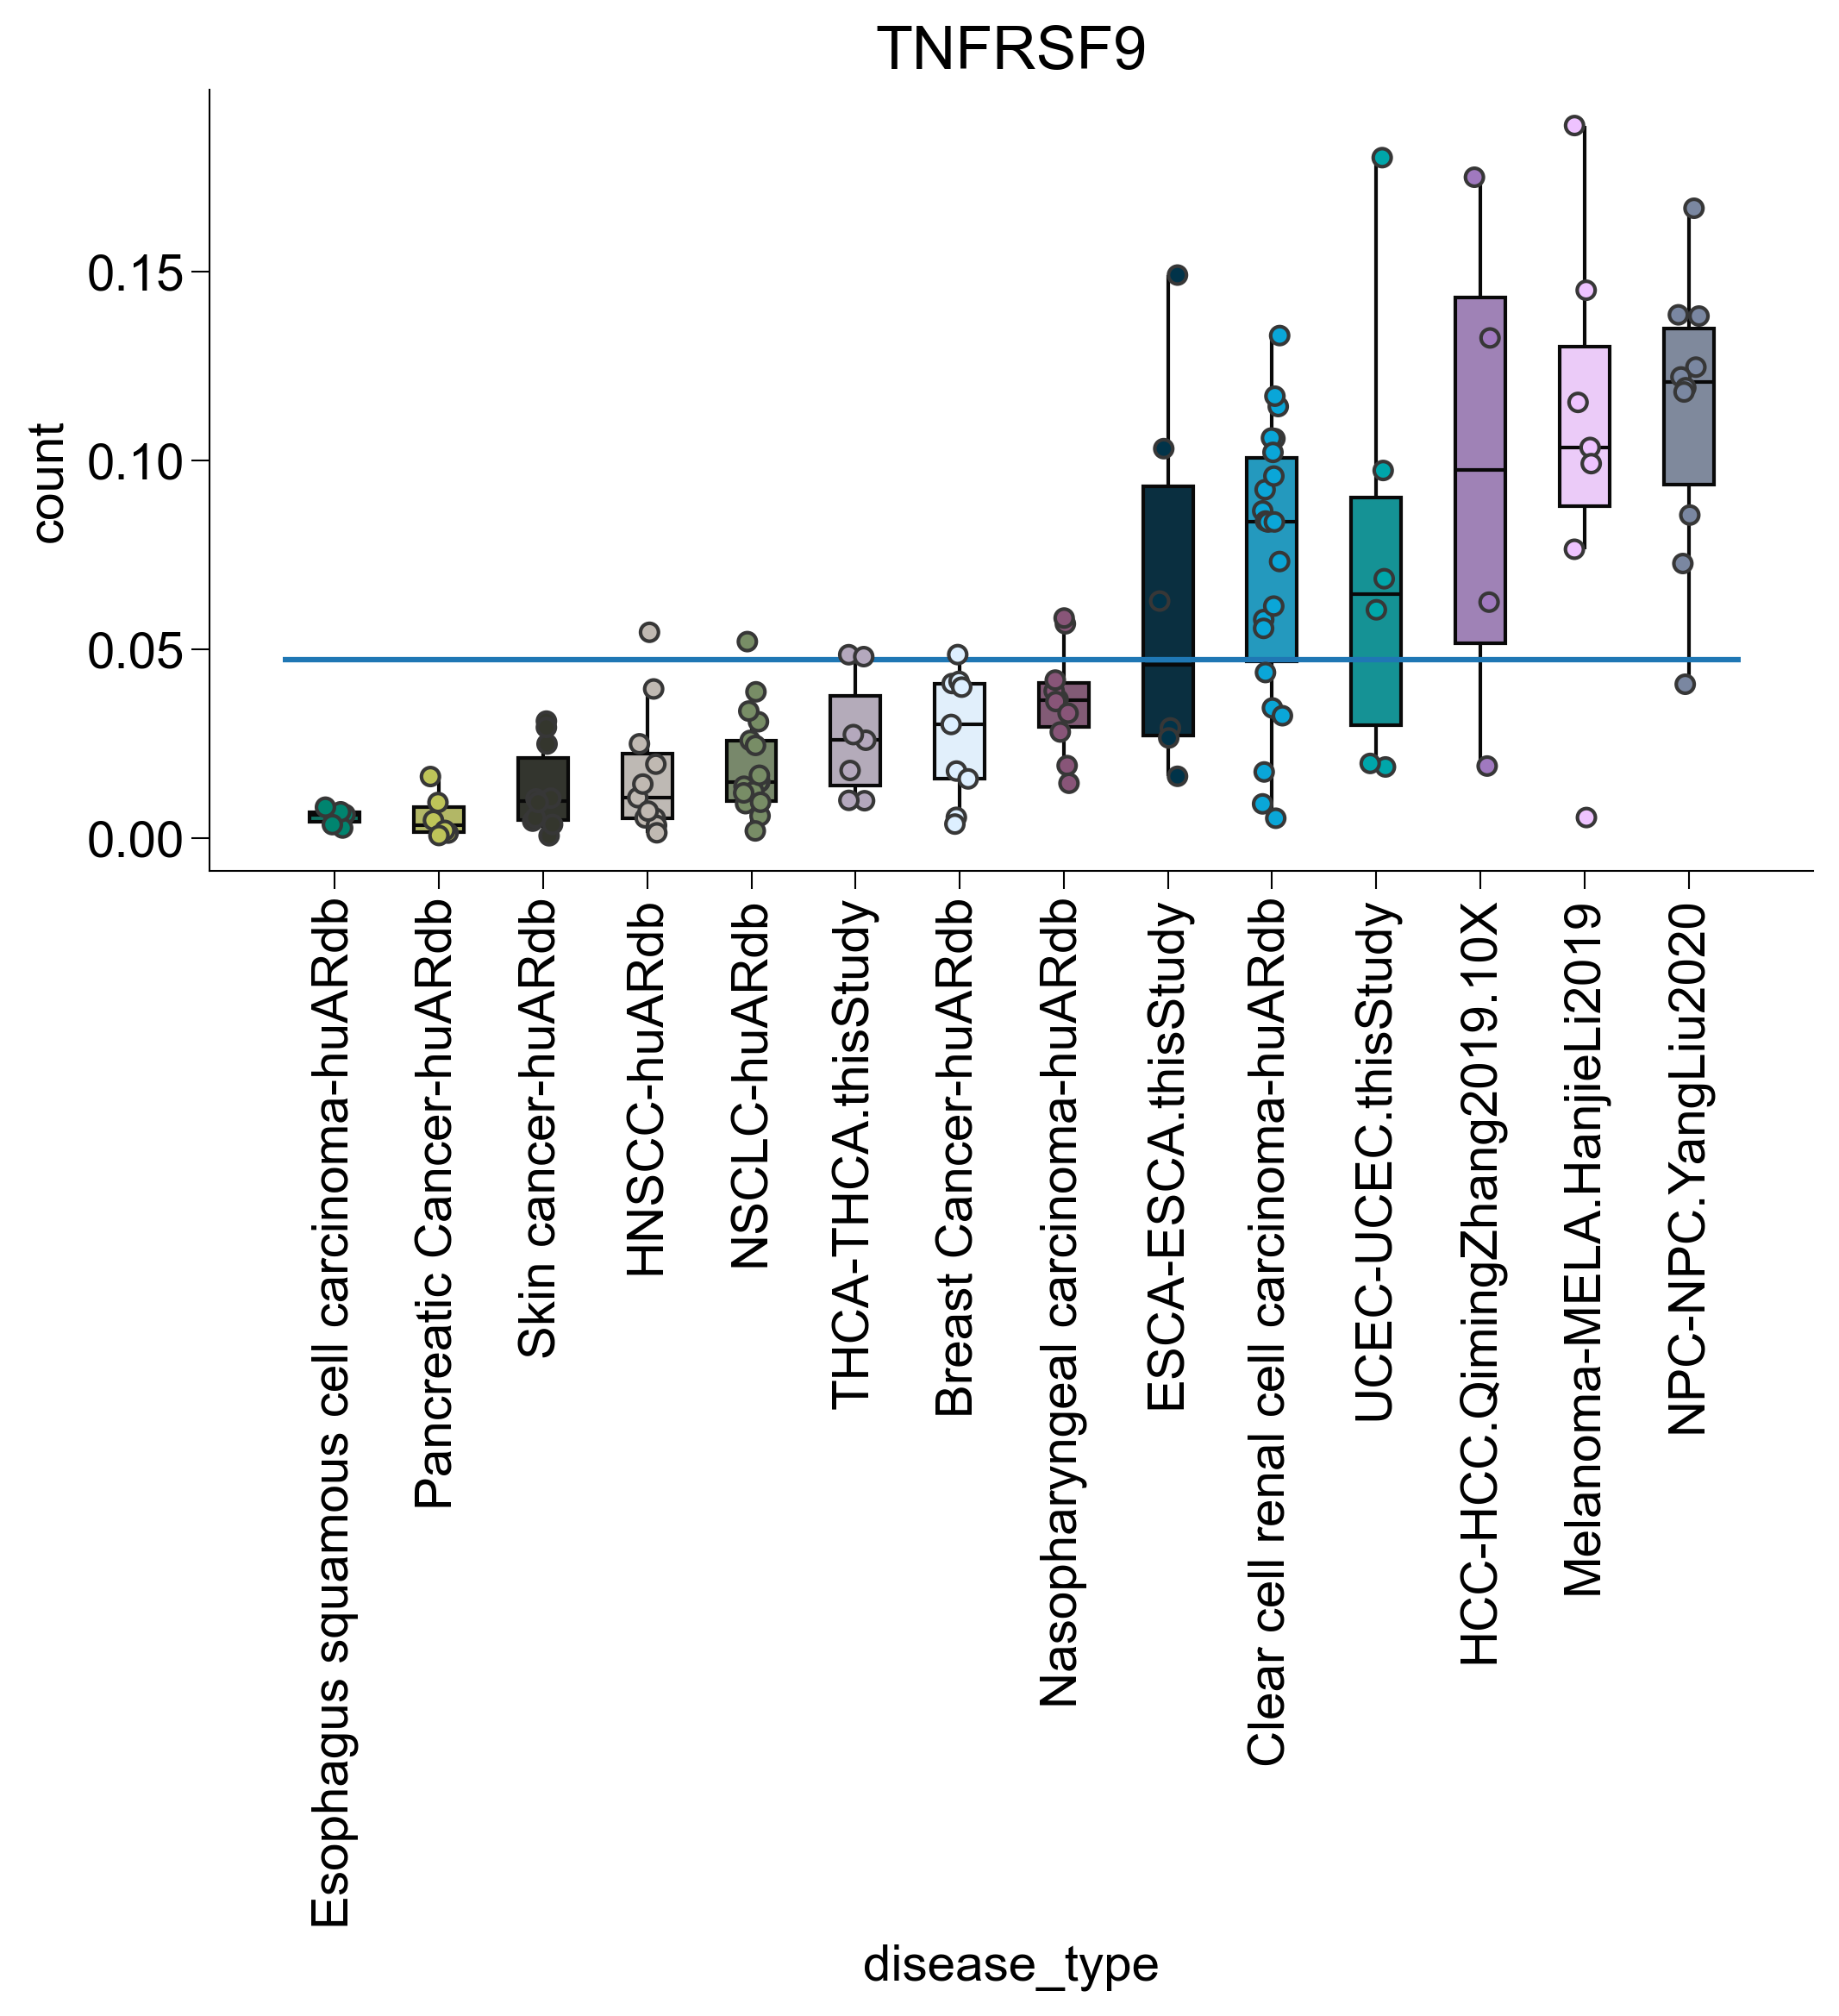
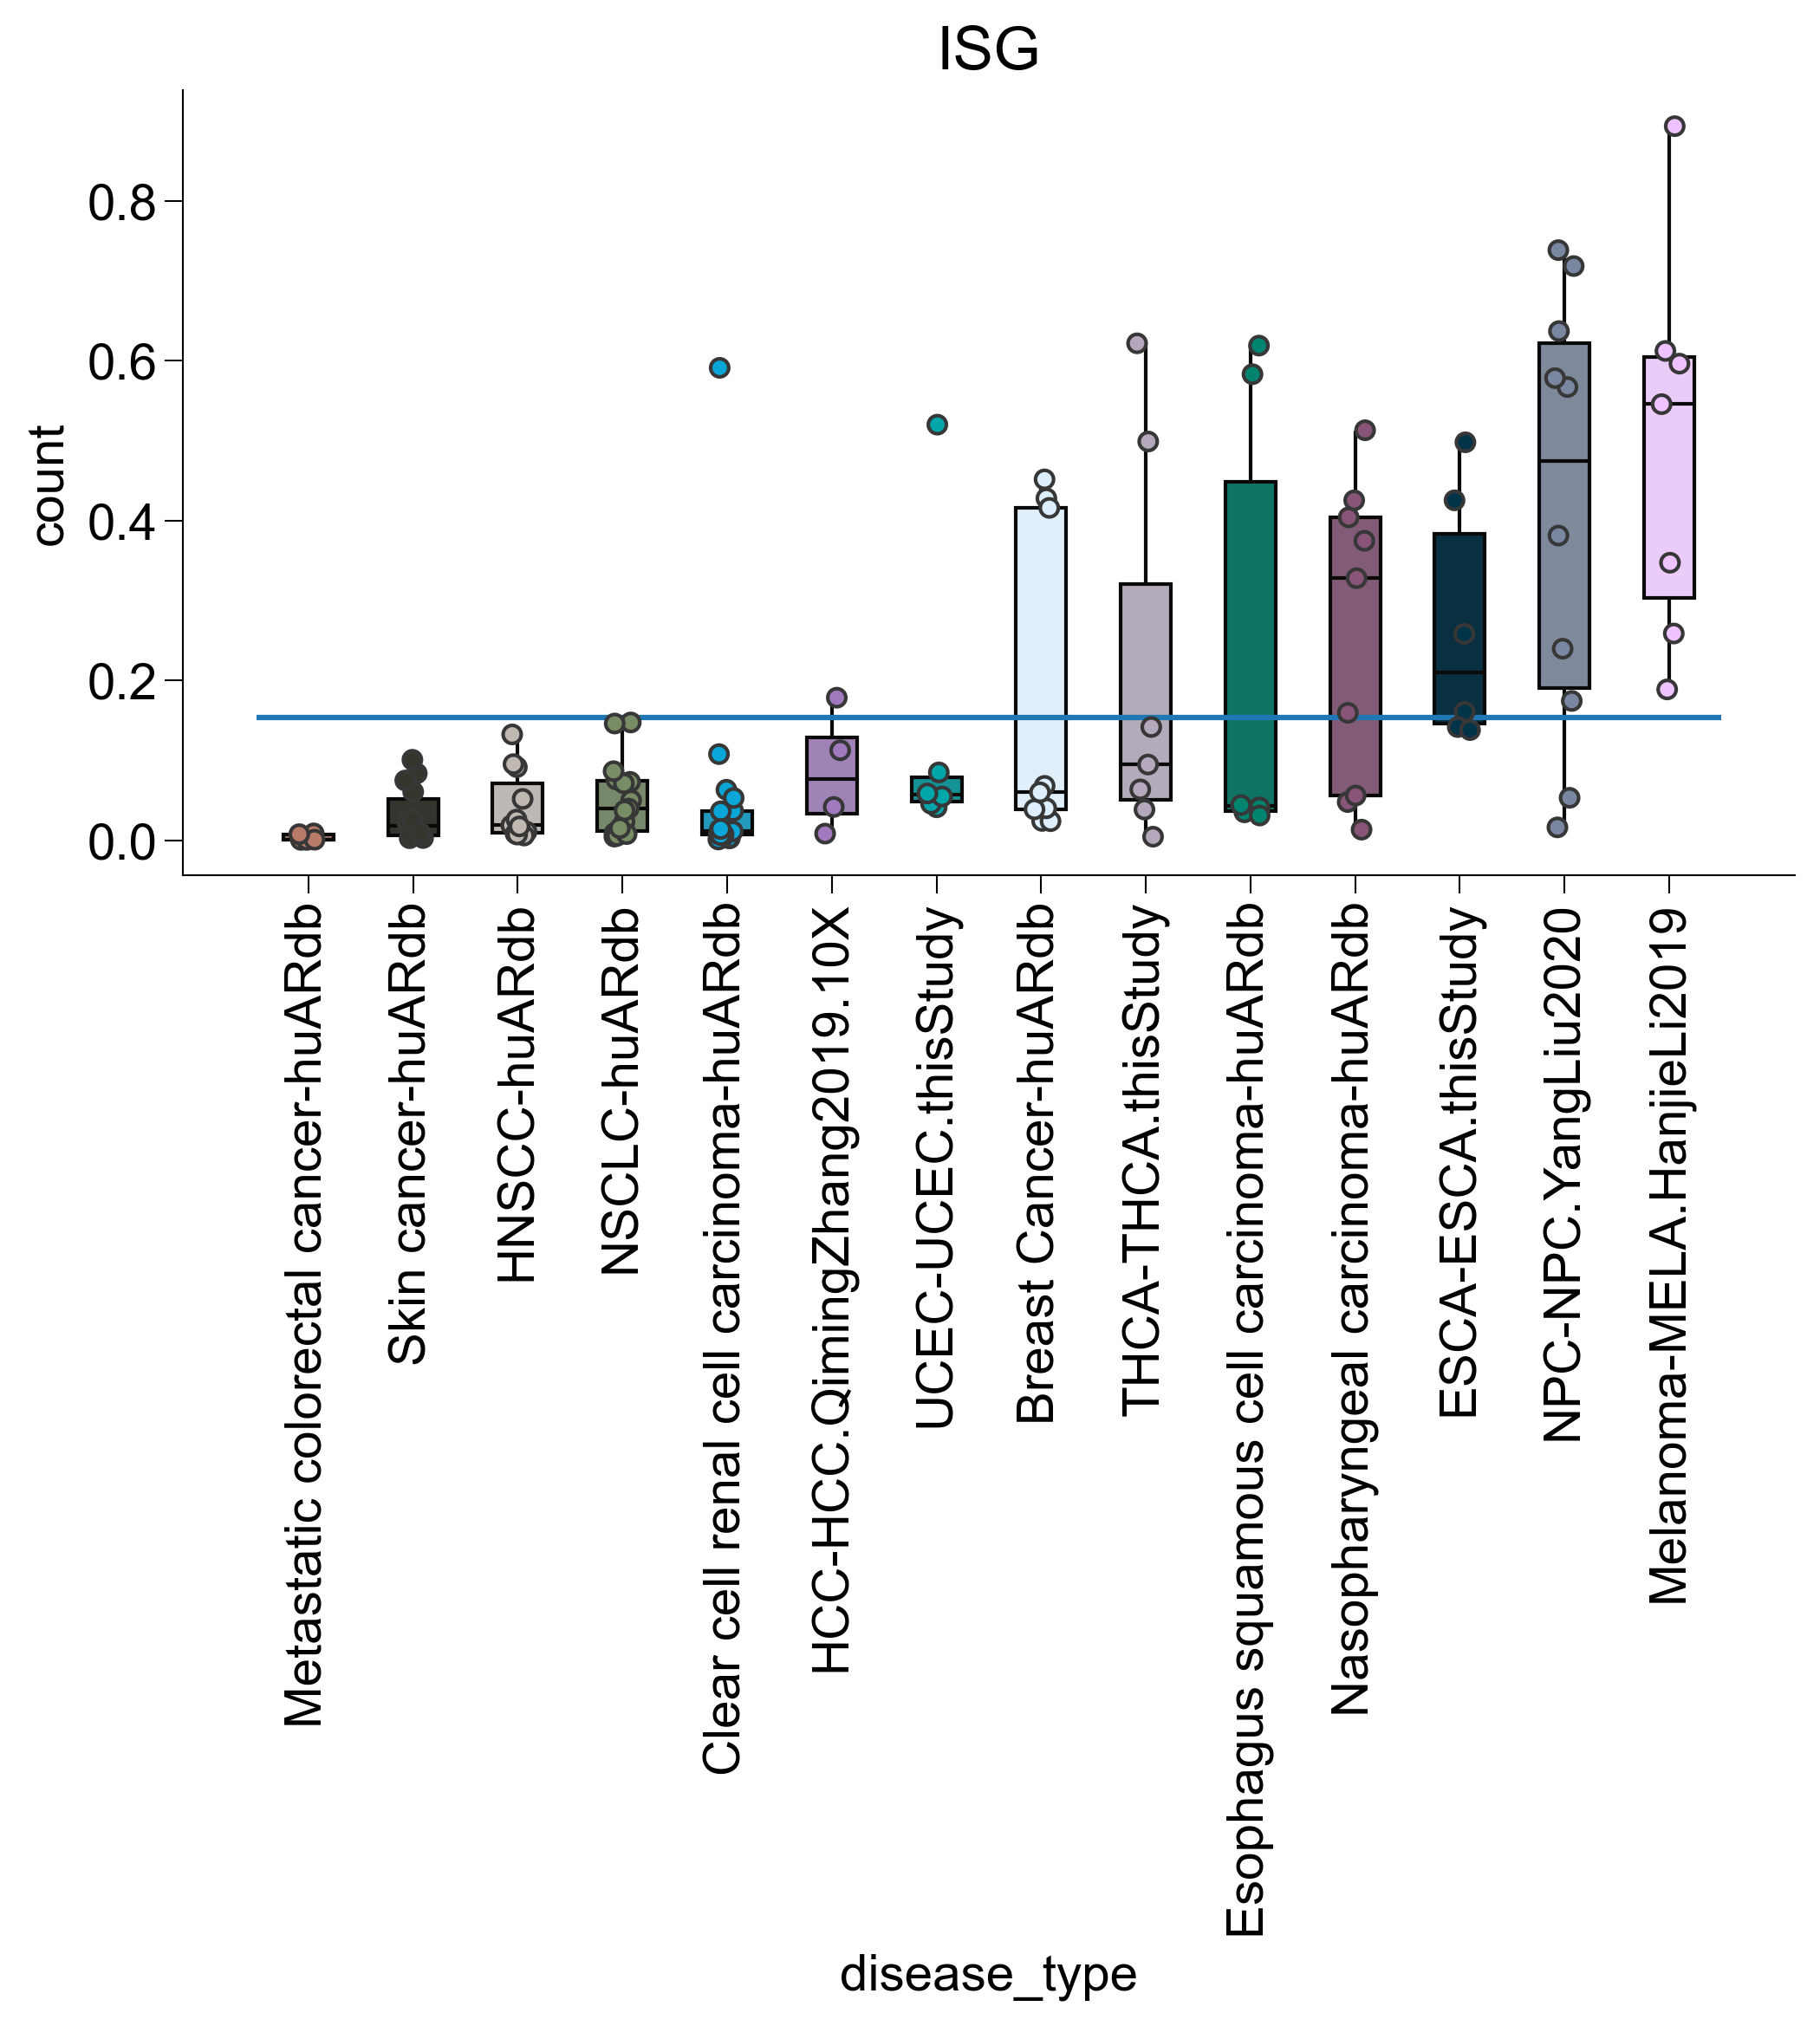
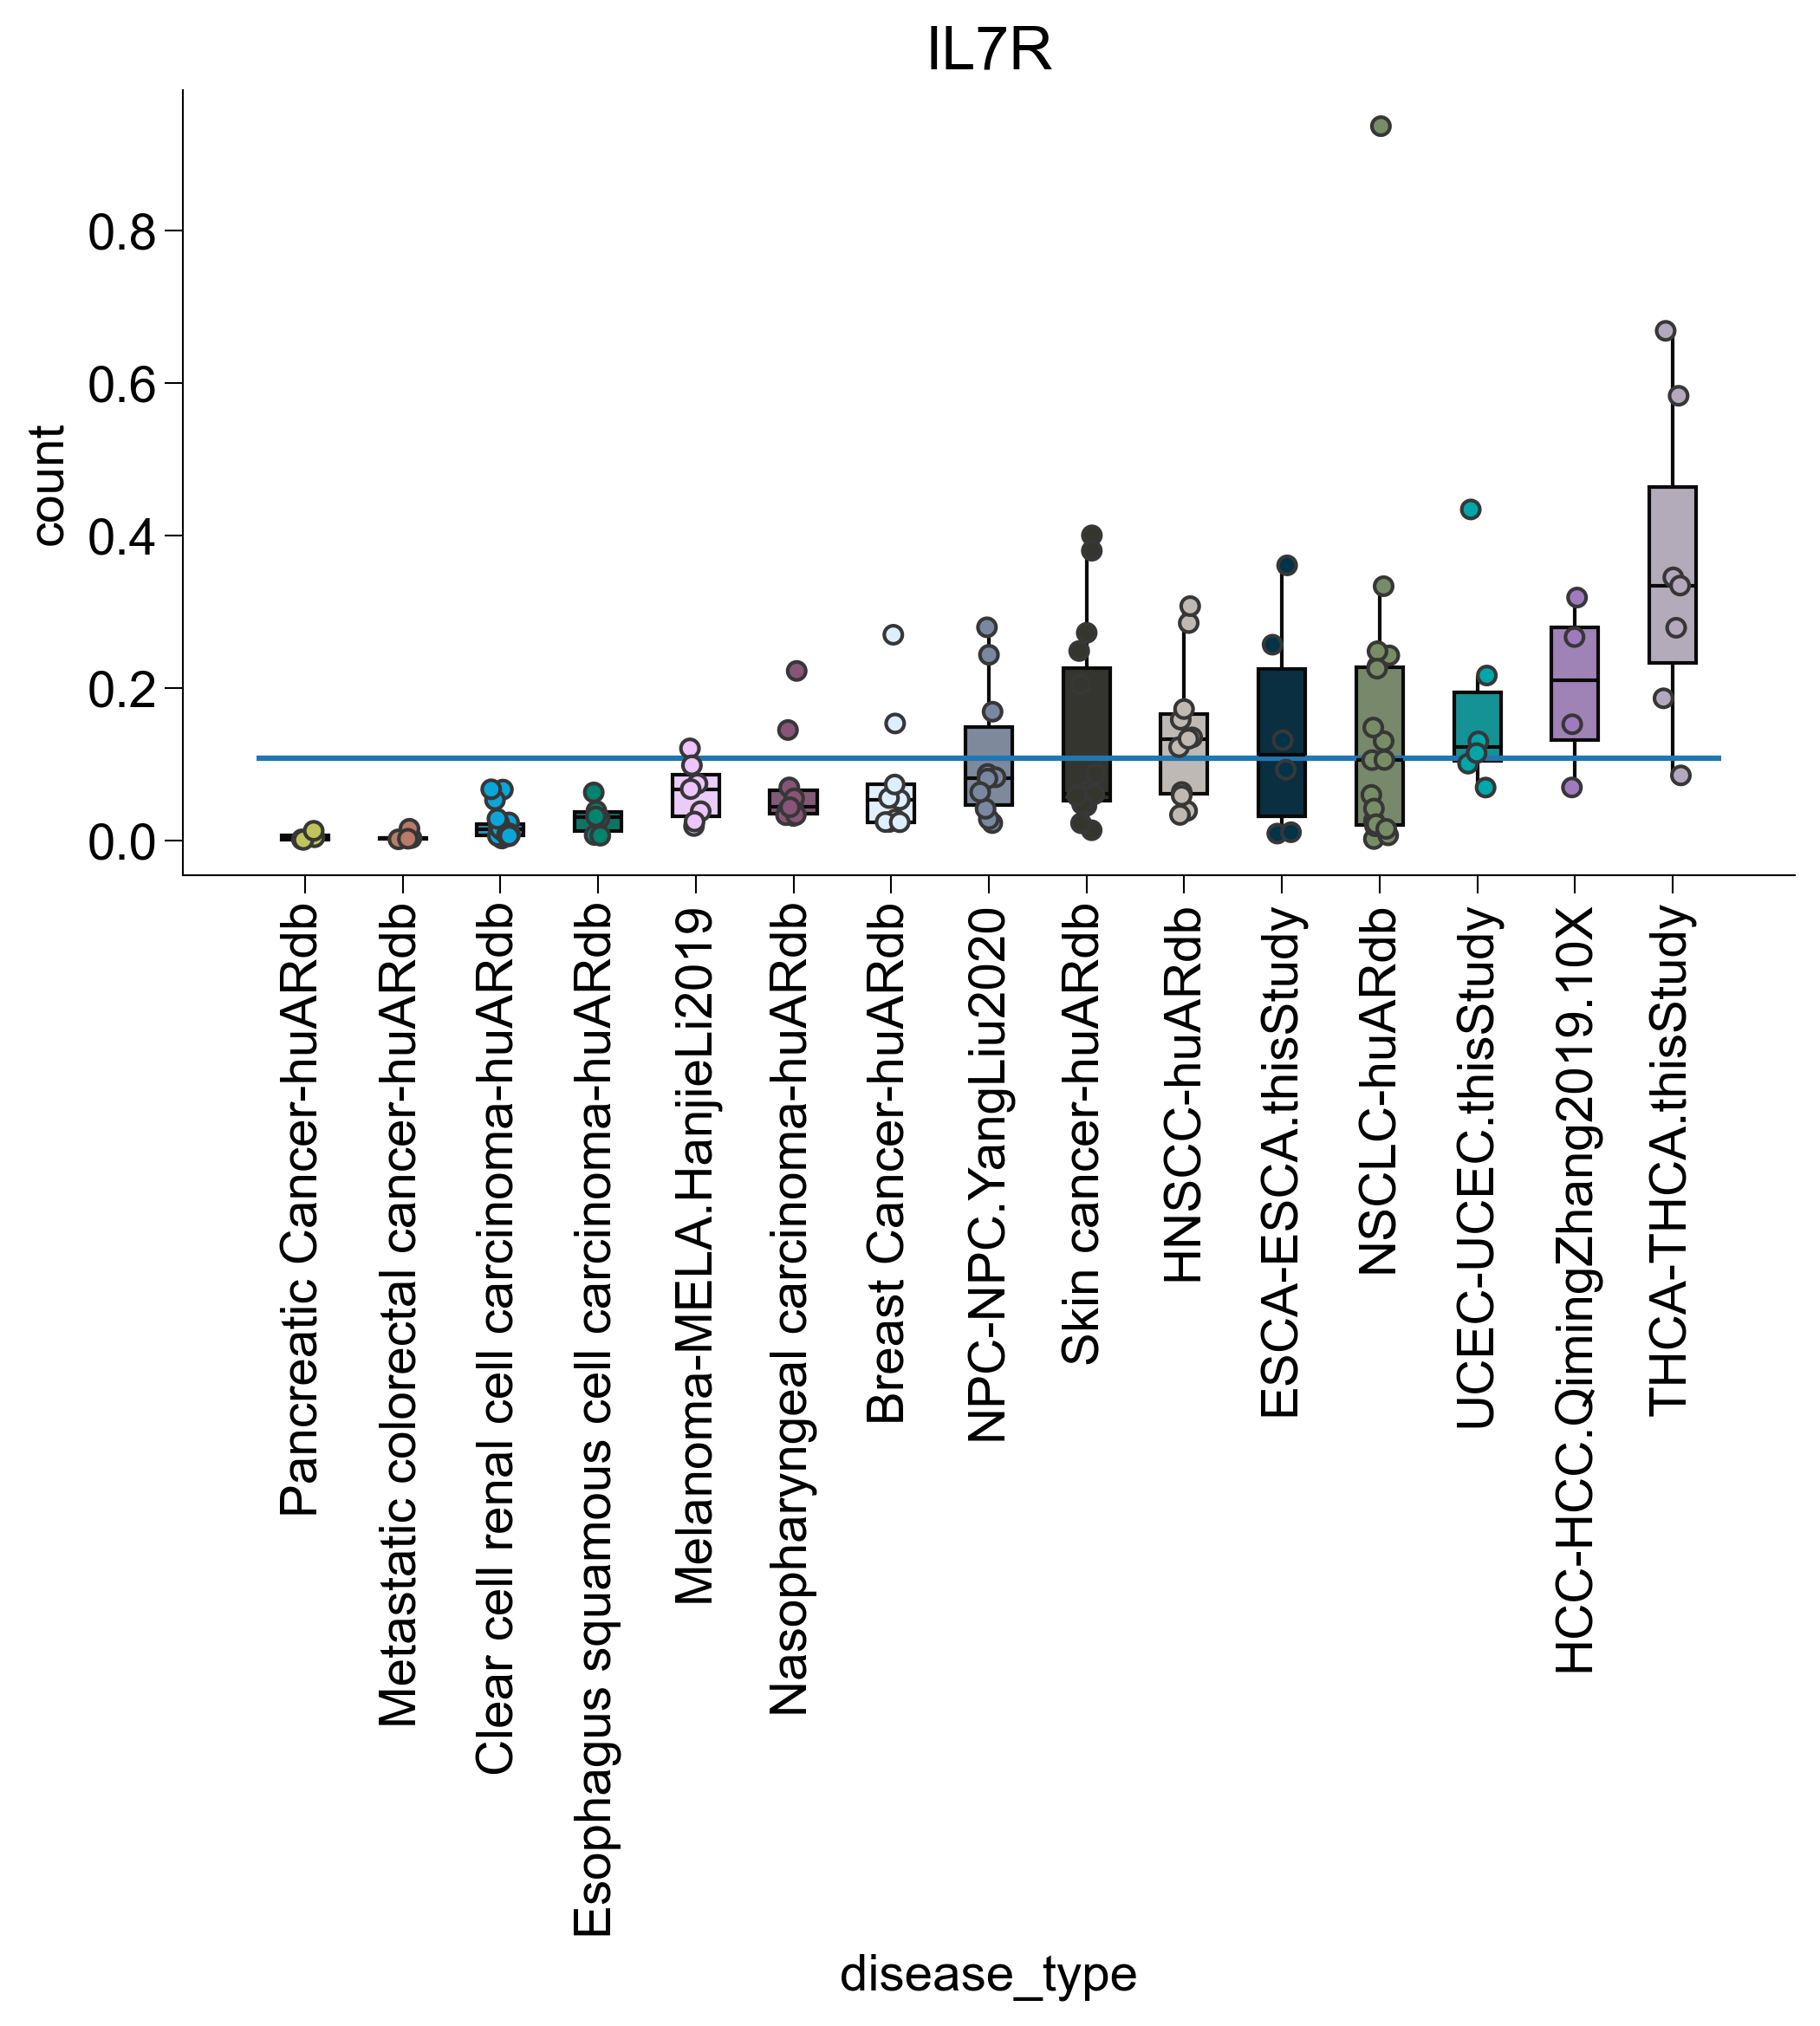
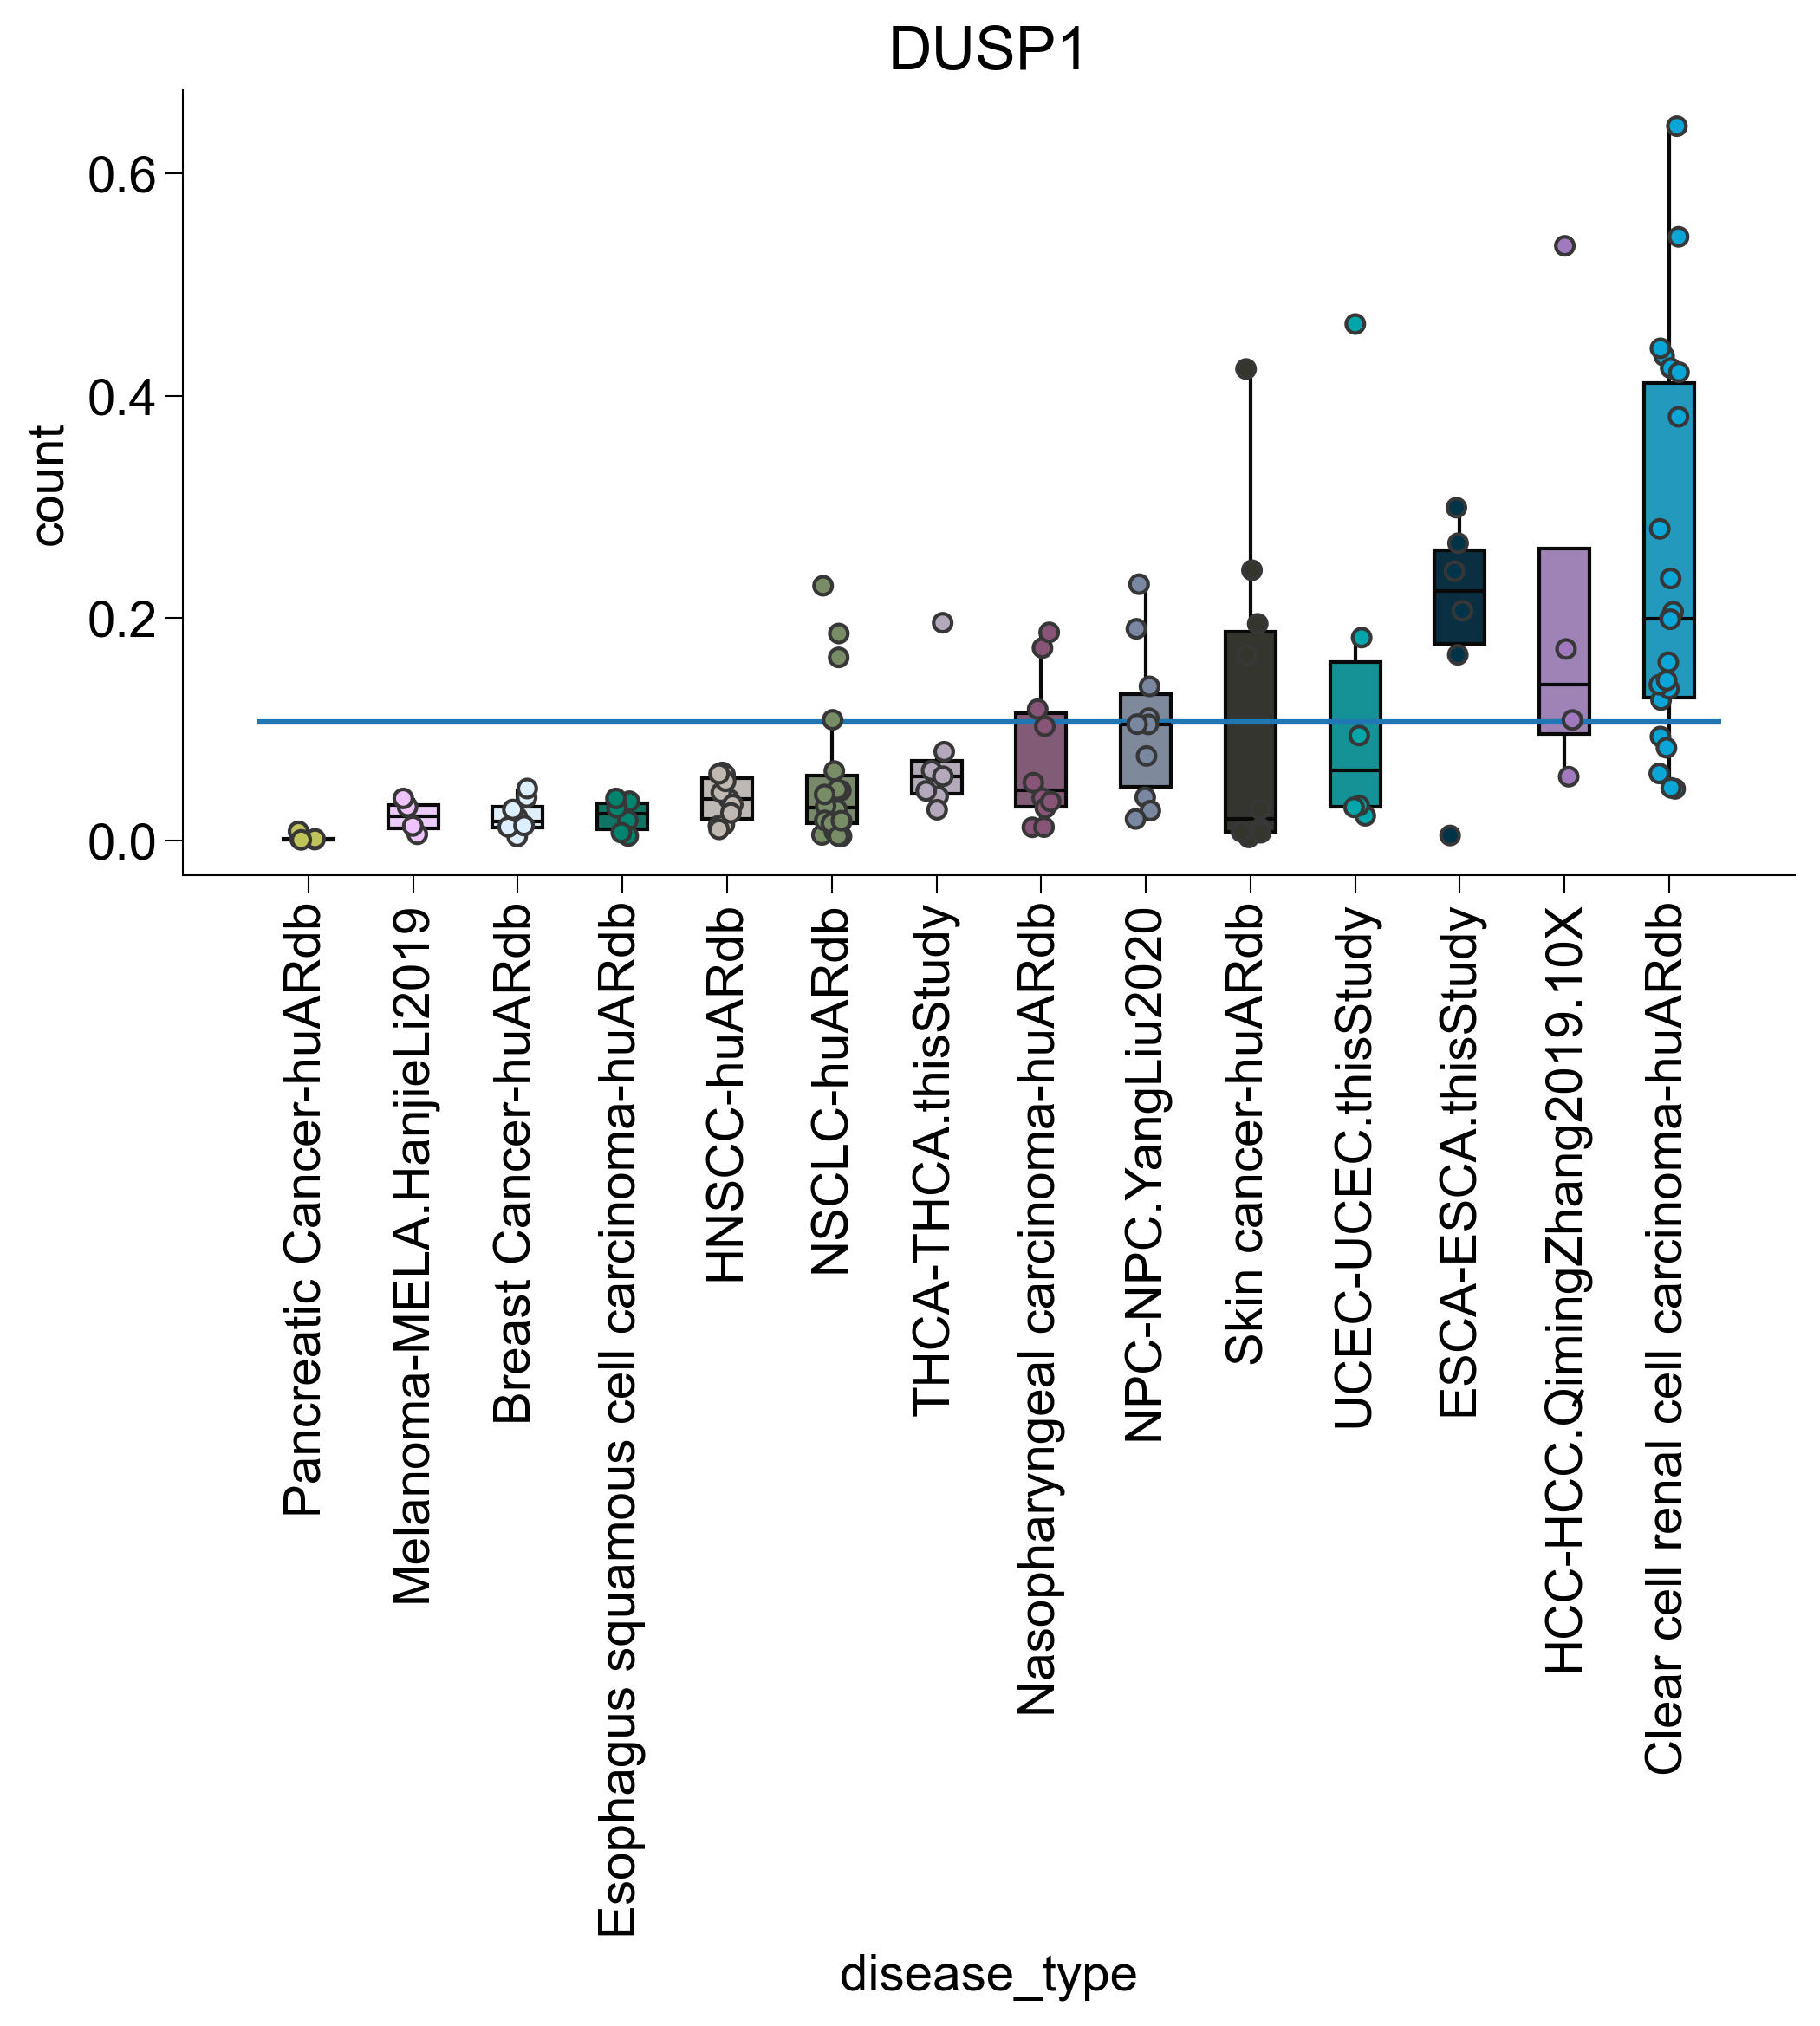
Extended Data Figure 10j-m
adata_cd8_zheng_2021_tex_tpex.obs["disease_type"] = list(
    map(lambda x: x.split(".")[0], adata_cd8_zheng_2021_tex_tpex.obs.index)
)
adata_cd8_zheng_2021_tex_tpex.obs["disease_type"] = list(
    map(
        lambda x: x[0] + "-" + x[1],
        zip(
            adata_cd8_zheng_2021_tex_tpex.obs["disease_type"],
            adata_cd8_zheng_2021_tex_tpex.obs["study_name"],
        ),
    )
)

obs = adata_cd8_tex.obs
obs = obs[
    obs["study_name"].isin(
        list(
            map(
                lambda z: z[0],
                filter(lambda x: x[1] > 10, Counter(obs["study_name"]).items()),
            )
        )
    )
]
obs = obs[
    obs["sample_name"].isin(
        list(
            map(
                lambda z: z[0],
                filter(lambda x: x[1] > 10, Counter(obs["sample_name"]).items()),
            )
        )
    )
]
sample_information = pd.read_csv(
    "/Users/snow/Desktop/sample_information.csv", index_col=0
)
obs["tissue_type"] = list(sample_information.loc[obs["sample_name"], "Tissue Metatype"])
obs = obs[obs["tissue_type"] == "TIL"]
obs["disease_type"] = list(sample_information.loc[obs["sample_name"], "Disease"])
obs["disease_meta_type"] = list(
    sample_information.loc[obs["sample_name"], "Disease Metatype"]
)
obs["treatment_status"] = list(
    sample_information.loc[obs["sample_name"], "Treatment Status"]
)
obs = obs[obs["disease_meta_type"] == "Solid tumor"]
obs["disease_type"] = (
    obs["disease_type"]
    .replace("Melanoma", "Skin cancer")
    .replace("Basal cell carinoma tumor", "Skin cancer")
    .replace("Squamous cell carcinoma tumor", "Skin cancer")
)
obs["disease_type"] = list(
    map(lambda x: x[1] + "-huARdb", zip(obs["study_name"], obs["disease_type"]))
)

sample_information_zheng_2021 = pd.read_csv(
    "PanCancerdata.expression/expression/CD8/integration/int.CD8.S35.meta.tb.csv",
    index_col=0,
)
sample_information_zheng_2021.index = list(sample_information_zheng_2021.iloc[:, 0])
adata_cd8_zheng_2021_tex_tpex.obs["tissue_type"] = sample_information_zheng_2021.loc[
    adata_cd8_zheng_2021_tex_tpex.obs.index
]["loc"]
adata_cd8_zheng_2021_tex_tpex = adata_cd8_zheng_2021_tex_tpex[
    adata_cd8_zheng_2021_tex_tpex.obs["tissue_type"] == "T"
]

obs = pd.concat(
    [
        obs,
        adata_cd8_zheng_2021_tex_tpex.obs[
            ~adata_cd8_zheng_2021_tex_tpex.obs["study_name"].isin(
                ["BCC.KathrynEYost2019", "SCC.KathrynEYost2019"]
            )
        ],
    ]
)

disease_palette = dict(zip(np.unique(obs["disease_type"]), sc.pl.palettes.godsnot_102[26:]))
c = Counter(obs["sample_name"])
agg = obs.groupby(["disease_type", "sample_name", "cell_subtype_4"]).agg(
    {"sample_name": lambda x: len(x) / c[list(x)[0]]}
)


agg.columns = ["count"]
agg = pandas_aggregation_to_wide(agg[~agg.iloc[:, 0].isna()])

for subtype in ["TNFRSF9", "ISG", "IL7R", "DUSP1"]:
    agg2 = pandas_aggregation_to_wide(
        agg[list(map(lambda x: subtype in x, agg["cell_subtype_4"]))]
        .groupby(["disease_type", "sample_name"])
        .agg({"count": sum})
    )

    s = set(list(map(lambda z: z[0], filter(lambda x: x[1] > 100, c.items()))))
    agg2 = agg2[list(map(lambda x: x in s, agg2["sample_name"]))]

    s = set(
        list(
            map(
                lambda x: x[0],
                list(filter(lambda x: x[1] > 3, Counter(agg2["disease_type"]).items())),
            )
        )
    )
    agg2 = agg2[list(map(lambda x: x in s, agg2["disease_type"]))]

    rank = dict(
        zip(
            agg2.groupby("disease_type")
            .agg({"count": np.mean})
            .sort_values("count")
            .index,
            range(len(np.unique(agg2["disease_type"]))),
        )
    )

    agg2["disease_type_rank"] = list(map(lambda x: rank.get(x), agg2["disease_type"]))
    agg2 = agg2.sort_values("disease_type_rank")

    fig, ax = createFig()
    sns.boxplot(
        data=agg2,
        x="disease_type",
        y="count",
        showfliers=False,
        palette=disease_palette,
        showcaps=False,
    )
    sns.stripplot(
        data=agg2,
        x="disease_type",
        y="count",
        dodge=False,
        palette=disease_palette,
        edgecolor="#373737",
        linewidth=1,
    )

    ax.hlines(
        xmin=ax.get_xbound()[0], xmax=ax.get_xbound()[1], y=np.mean(agg2["count"])
    )
    plt.xticks(rotation=90)
    adjust_box_widths(fig, 0.6)
    ax.set_title(subtype)