(Part II) Analyzing the pan-disease CD8+ T atlas
Contents
(Part II) Analyzing the pan-disease CD8+ T atlas
This notebook contains codes for analyzing the pan-disease CD8+ T atlas established from scAtlasVAE.
Please check the package version at https://github.com/WanluLiuLab/scAtlasVAE/blob/master/environment.yml for reproducing the results.
For more information about the scAtlasVAE model, please see https://scatlasvae.readthedocs.io/en/latest/.
For retrieving datasets, please see https://zenodo.org/records/10472914.
SetupEnvironment
cd /Volumes/rsch/GEXnb_rev/
/Volumes/rsch/GEXnb_rev
pwd
'/Volumes/rsch/GEXnb_rev'
import time
import xlwt
import gseapy
import numpy as np
import pandas as pd
import matplotlib as mpl

import scanpy as sc
import scirpy as ir
import scvelo as scv

import networkx as nx
import seaborn as sns
import matplotlib.pyplot as plt
from collections import Counter
import scipy
from scipy import stats
from scipy.stats.contingency import odds_ratio
from scipy.integrate import odeint
from matplotlib_venn import venn2, venn3
from scanpy.plotting._anndata import _prepare_dataframe

setPltLinewidth(0)

plt.rcParams.update(plt.rcParamsDefault)
plt.rcParams['figure.dpi'] = 150
plt.rcParams['savefig.dpi'] = 150
plt.rcParams['font.size'] = 15
plt.rcParams['axes.linewidth'] = 0
plt.rcParams['font.family'] = "Arial"

mpl.rcParams['pdf.fonttype'] = 42
mpl.rcParams['ps.fonttype'] = 42
## color_palette
subtype_color = {
    'Tn':'#CEBF8F',
    'Tcm':'#ffbb78',
    'Early Tcm/Tem':'#ff7f0e',
    'GZMK+ Tem':'#d62728',
    'GNLY+ Temra':'#8c564b',
    'CMC1+ Temra':'#e377c2',
    'ZNF683+ Teff':'#6f3e7c',
    'MAIT':'#17becf',
    'ILTCK':'#aec7e8',
    'ITGAE+ Trm':'#279e68',
    'CREM+ Trm':'#aa40fc',
    'ITGB2+ Trm':'#5ce041',
    'Tpex':'#ff9896',
    'GZMK+ Tex':'#9f80b8',
    'ITGAE+ Tex':'#e8c0ba',
    'XBP1+ Tex':'#b5bd61',
    'MACF1+ T':'#3288c9',
    'Cycling T':'#f7b6d2'
}

main_type_color = {
    'Tn':'#CEBF8F',
    'Tcm/Tem':'#ff7f0e',
    'Temra':'#8c564b',
    'MAIT':'#17becf',
    'ILTCK':'#aec7e8',
    'Trm':'#279e68',
    'Tex':'#e8c0ba',
    'MACF1+T':'#3288c9',
    'CyclingT':'#f7b6d2'
}

disease_type_color = {
    'Healthy':"#E84C36",
    'Infection':"#4CBDD7",
    'Inflammation':"#1DA088",
    'irAE_inflammation':"#3C5589",
    'Solid tumor':"#F49C7F",
    'Myeloma':"#8492B5",
    'Leukemia':"#91D1C2",
    'Fraility':'#1f77b4',
    'Organoid':'#aa40fc'
}

meta_tissue_type_color = {
    "Circulating":'#ff7f0e',
    "Tissue":'#1f77b4',
    "TIL":'#279e68',
    "Others":'#aa40fc',
}

tissue_type_color = {
    'PBMC':'#ffbb78',
    'Bone Marrow':'#b5bd61',
    'Spleen':'#ff817b',
    'Lymph Node':'#e377c2',
    'Normal Tissue':'#aec7e8',
    'Paratumor Tissue':'#c5b0d5',
    'Inflamed Tissue':'#8c564b',
    'Infected Tissue':'#ff9896',
    'TIL':'#98df8a',
    'st_PBMC':'#17becf',
    'PBMC/BALF':'#939292',
    'Organoid':'#aa40fc',
    'Thymus':'#B0BEC5',
}

sorting_color = {
    'normal_CD8': '#E6DCD9',
    'mem_CD8': '#FFAF00',
    'PD1_CD8': '#389663',
    'CD39_CD8': '#8256ED',
    'st_CD8':'#BBD400',
    'ag_specific': '#FF5F5F',
    'sorted_CD4': '#009EB2',
    'undetermined': '#7F7F7F'
}
## lists
meta_cell_subsets = [
    'normal_CD8',
    'mem_CD8',
    'PD1_CD8',
    'CD39_CD8',
    'st_CD8',
    'ag_specific',
    'sorted_CD4',
    'undetermined'
]

disease_types = [
    'Healthy',
    'Infection',
    'Inflammation',
    'irAE_inflammation',
    'Solid tumor',
    'Myeloma',
    'Leukemia',
    'Fraility'
]

disease_types_tex = [
    'Healthy',
    'Infection',
    'Inflammation',
    'irAE_inflammation',
    'Solid tumor',
]

cell_subtypes = [
    'Tn',
    'Tcm',
    'Early Tcm/Tem',
    'GZMK+ Tem',
    'GNLY+ Temra',
    'CMC1+ Temra',
    'ZNF683+ Teff',
    'MAIT',
    'ILTCK',
    'ITGAE+ Trm',
    'CREM+ Trm',
    'ITGB2+ Trm',
    'Tpex',
    'GZMK+ Tex',
    'ITGAE+ Tex',
    'XBP1+ Tex',
    'MACF1+ T',
    'Cycling T',
]

cell_subtype_aggrs = [
    'Tn', 'Tcm/Tem', 'Temra/Teff',
    'MAIT', 'ILTCK',
    'Trm', 'Tex',
    'MACF1+T', 'CyclingT'
]

meta_tissue_type_aggrs = [
    "Circulating",
    "Tissue",
    "TIL",
    "Others",
]

meta_tissue_types = [
    'PBMC',
    'Bone Marrow',
    'Spleen',
    'Lymph Node',
    'Normal Tissue',
    'Paratumor Tissue',
    'Inflamed Tissue',
    'Infected Tissue',
    'TIL',
    'st_PBMC',
    'Organoid',
    'Thymus',
]

expansion_levels = [
    'No expansion',
    'Expansion2-5',
    'Expansion6-50',
    'Expansion51-100',
    'Expansion>100'
]

circ_tissue = [
    'Boland_2020', ## UC
    'Simone_2021', ## AS
    'Kim_2022', ## irAE-Arthritis
    'Borcherding_2021', ## ccRCC(PBMC)
    'Krishna_2021', ## ccRCC(PBMC)
    'Liu_2021', ## NPC(PBMC)
    ## new datasets
    'Shi_2022', #ICC,GBC(PBMC)
    'Sun_2022', #GC(PBMC)
    'Pai_2023', #NSCLC(LN,not PBMC)
    'Rahim_2023', #HNSCC(LN,not PBMC)
    'Liu_2022', #BC(LN,not PBMC),
]
LoadData
adata_nogex = sc.read_h5ad('source/20240131huARdb_v2_GEX.CD8_nob.hvg4k.vae.processed.h5ad')
adata_gene = sc.read_h5ad('source/20240131huARdb_v2_GEX.CD8.all_genes.h5ad') ## no liver study
clone_subtype = pd.read_csv('source/20240131clone_subtype.csv', index_col=0)
## Subset adata
## tissue_types_subset
adata_circ = adata_nogex[adata_nogex.obs['meta_tissue_type_aggr'].str.contains('Circulating')]
adata_tissue = adata_nogex[adata_nogex.obs['meta_tissue_type_aggr'].str.contains('Tissue')]
adata_tissue_TIL = adata_nogex[(adata_nogex.obs['meta_tissue_type_aggr'].str.contains('Tissue')) |
                               (adata_nogex.obs['meta_tissue_type_aggr'] == 'TIL')]
adata_tumor_tissue = adata_nogex[(adata_nogex.obs['disease_type']=='Solid tumor')&
                                 (adata_nogex.obs['meta_tissue_type_aggr']=='Normal Tissue')]
adata_tissue_TIL = adata_tissue_TIL[~adata_tissue_TIL.obs.index.isin(adata_tumor_tissue.obs.index)]
[SKIP]ClonotypeTableProcessing
def clone_df_generate(adata):
    clonotype_composition = pandas_aggregation_to_wide ( adata.obs.groupby("cc_aa_identity").agg({
        "cell_subtype_3": lambda x: dict(Counter(x))
    }) )
    clone_df = pd.DataFrame(list(clonotype_composition['cell_subtype_3'].to_numpy()),
                                 index=clonotype_composition['cc_aa_identity']).fillna(0)

    clone_df = clone_df[cell_subtypes]
    clone_df['total'] = clone_df.iloc[:,0:18].sum(axis=1)
    clone_df['total_Tcmem'] = clone_df.iloc[:,1:4].sum(axis=1)
    clone_df['total_Temra'] = clone_df.iloc[:,4:7].sum(axis=1)
    clone_df['total_Trm'] = clone_df.iloc[:,9:12].sum(axis=1)
    clone_df['total_Tex'] = clone_df.iloc[:,13:16].sum(axis=1)
    ## add cell source
    meta_tissue_type_composition = pandas_aggregation_to_wide ( adata.obs.groupby("cc_aa_identity").agg({
        "meta_tissue_type_aggr": lambda x: dict(Counter(x))
    }) )
    clone_df = clone_df.join(pd.DataFrame(list(
        meta_tissue_type_composition['meta_tissue_type_aggr'].to_numpy()
    ), index=meta_tissue_type_composition['cc_aa_identity']).fillna(0))

    for i in ['individual_id', 'study_name', 'sample_name', 'meta_cell_subset', 'disease', 'disease_type']:
        cloneid_to_obs = dict(zip(adata.obs['cc_aa_identity'], adata.obs[i]))
        clone_df[i] = list(map(cloneid_to_obs.get, clone_df.index))
    ## define expansion
    clone_df.loc[clone_df['total']>=3, 'expansion']='Expanded'
    clone_df.loc[clone_df['total']<3, 'expansion']='NoExpanded'

    ## define dominant clonotype
    ## define ambiguous clonotype with equal maximum value
    _clone = clone_df.iloc[:,0:17]
    clone_df['dominant'] = _clone.idxmax(axis=1)
    clone_df['dominant_num'] = _clone.max(axis=1)
    clone_df['non_dominant_num'] = clone_df['total']-clone_df['dominant_num']

    amb_id = _clone.eq(_clone.max(axis=1), axis=0).sum(axis=1)
    clone_df['dominant'] = clone_df['dominant'].mask(amb_id > 1, 'Equality')

    return clone_df
ClonotypeDefinition
TRAB_DEFINITION_ORIG
['IR_VJ_1_junction_aa',
 'IR_VDJ_1_junction_aa',
 'IR_VJ_1_v_call',
 'IR_VJ_1_j_call',
 'IR_VDJ_1_v_call',
 'IR_VDJ_1_j_call']
adata_nogex.obs['tcr'] = list(map(lambda x: '-'.join(x),
      adata_nogex.obs.loc[:,TRAB_DEFINITION_ORIG + ['individual_id']].to_numpy()
))
adata_nogex.obs['tcr']
AAACCTGAGGTGCTAG-10x_Datasets-10k_BEAM-T_Human_A0201_CMV_Flu_Covid_spikein_5pv2    CAAGGSQGNLIF-CASSIRSSYEQYF-TRAV27-TRAJ42-TRBV1...
AAACCTGAGTGGAGTC-10x_Datasets-10k_BEAM-T_Human_A0201_CMV_Flu_Covid_spikein_5pv2    CARNTGNQFYF-CASSLGTGIGYYGYTF-TRAV24-TRAJ49-TRB...
AAACCTGCACGGCGTT-10x_Datasets-10k_BEAM-T_Human_A0201_CMV_Flu_Covid_spikein_5pv2    CAVSAINEKLTF-CASLYGGGGNEQFF-TRAV8-6-TRAJ48-TRB...
AAACCTGCACTTAACG-10x_Datasets-10k_BEAM-T_Human_A0201_CMV_Flu_Covid_spikein_5pv2    CAGGGSQGNLIF-CASSIRSSYEQYF-TRAV27-TRAJ42-TRBV1...
AAACCTGCAGGCTCAC-10x_Datasets-10k_BEAM-T_Human_A0201_CMV_Flu_Covid_spikein_5pv2    CAADDTNTGNQFYF-CASLYGGGGNEQFF-TRAV41-TRAJ49-TR...
                                                                                                         ...
TTAGTTCAGCTAAACA-Simone_2021-AS02_SF                                               CAFLDDQGGKLIF-CASSAGAGGADTQYF-TRAV24-TRAJ23-TR...
TTCCCAGCAATGCCAT-Simone_2021-AS02_SF                                               CATHGDSGYALNF-CASSWGQSYEQYF-TRAV17-TRAJ41-TRBV...
TTCGAAGAGCTAACTC-Simone_2021-AS02_SF                                               CAASTAQGGSEKLVF-CASSYWGDQPQHF-TRAV23DV6-TRAJ57...
TTGCCGTCAATGCCAT-Simone_2021-AS02_SF                                               CAVGNTDKLIF-CASTTGEYQPQHF-TRAV39-TRAJ34-TRBV28...
TTGCGTCTCGGATGTT-Simone_2021-AS02_SF                                               CAANSPSSNTGKLIF-CSARDQGSGLIYEQYF-TRAV29DV5-TRA...
Name: tcr, Length: 1151695, dtype: object
cloneid = dict(zip(np.unique(adata_nogex.obs['tcr']), list(range(len(np.unique(adata_nogex.obs['tcr']))))))
adata_nogex.obs['cc_aa_identity'] = list(map(cloneid.get, adata_nogex.obs['tcr']))
len(np.unique(adata_nogex.obs['tcr']))
498679
clone_subtype = clone_df_generate(adata_nogex)
clonesize_to_obs = dict(zip(clone_subtype.index, clone_subtype['total']))
adata_nogex.obs['cc_aa_identity_size'] = list(map(clonesize_to_obs.get, adata_nogex.obs['cc_aa_identity']))
adata_nogex.obs.loc[adata_nogex.obs['cc_aa_identity_size']==1,
                    'expansion_level']='No expansion'
adata_nogex.obs.loc[adata_nogex.obs['cc_aa_identity_size'].isin(range(2,6)),
                    'expansion_level']='Expansion2-5'
adata_nogex.obs.loc[adata_nogex.obs['cc_aa_identity_size'].isin(range(6,51)),
                    'expansion_level']='Expansion6-50'
adata_nogex.obs.loc[adata_nogex.obs['cc_aa_identity_size'].isin(range(51,101)),
                    'expansion_level']='Expansion51-100'
adata_nogex.obs.loc[adata_nogex.obs['cc_aa_identity_size']>100,
                    'expansion_level']='Expansion>100'
adata_nogex.obs.loc[adata_nogex.obs['cc_aa_identity_size']==1, 'expansion_size']='1'
adata_nogex.obs.loc[adata_nogex.obs['cc_aa_identity_size']==2, 'expansion_size']='2'
adata_nogex.obs.loc[adata_nogex.obs['cc_aa_identity_size']>=3, 'expansion_size']='Larger3'
SharingClonotype
def sharing_info(clone_info):
    clone_info_expanded = clone_info[(clone_info['total']>=3)]

    for i in cell_subtypes:
        ## larger than 20% of cells
        clone_info_expanded.loc[clone_info_expanded[i]>=0.2*clone_info_expanded['total'], i]=i
        clone_info_expanded.loc[clone_info_expanded[i]!=i, i]=None

    clone_info_expanded['sharing_type'] = clone_info_expanded.loc[:, cell_subtypes].apply(
        lambda x: '='.join(x.dropna().astype(str)), axis=1
    )
    clone_info_expanded['sharing_type'] = clone_info_expanded['sharing_type'].mask(
        ~clone_info_expanded['sharing_type'].str.contains('='), 'NoSharing')
    clone_info['sharing_type'] = clone_info_expanded['sharing_type'] ## transfer

    return clone_info
def dominant_sharing_info(clone_info, expanded=3):

    clone_info_expanded = clone_info[(clone_info['total']>=expanded)]
    clone_info_expanded_number = clone_info_expanded.iloc[:,0:18]

    clone_info_expanded_number['Cycling T'] = 0 ## exclude cycling
##     for i in cell_subtypes[:-1]:
##         ## clone_info_expanded_number.loc[clone_info_expanded_number[i]<3, i]=0
##         clone_info_expanded_number.loc[
##             clone_info_expanded_number[i]<0.2*clone_info_expanded['total'], i]=0

    clone_info_expanded['first'] = clone_info_expanded_number.columns[
        clone_info_expanded_number.values.argsort(1)[:, -1]]
    clone_info_expanded['second'] = clone_info_expanded_number.columns[
        clone_info_expanded_number.values.argsort(1)[:, -2]]

    ## require the second not equal to the third
    zero_id = clone_info_expanded_number.apply(
        lambda row: row.nlargest(2).values[-1],axis=1) == 0
    clone_info_expanded['first'] = clone_info_expanded['first'].mask(zero_id, 'NoSharing')
    clone_info_expanded['second'] = clone_info_expanded['second'].mask(zero_id, 'NoSharing')

    clone_info_expanded_number = clone_info_expanded_number[zero_id==False]
    qualified_id = clone_info_expanded_number.apply(
        lambda row: row.nlargest(2).values[-1],axis=1) == clone_info_expanded_number.apply(
        lambda row: row.nlargest(3).values[-1],axis=1)
    qualified_id = qualified_id[qualified_id==True]

    clone_info_expanded.loc[clone_info_expanded.index.isin(qualified_id.index), 'first'] = 'Equality'
    clone_info_expanded.loc[clone_info_expanded.index.isin(qualified_id.index), 'second'] = 'Equality'

    clone_info['first'] = clone_info_expanded['first']
    clone_info['second'] = clone_info_expanded['second']

    return clone_info
clone_subtype = sharing_info(clone_subtype)
clone_subtype = dominant_sharing_info(clone_subtype)
adata_gene = adata_gene[adata_nogex.obs.index,]
adata_gene.obs = adata_nogex.obs.copy()
## adata_nogex = adata_nogex[~adata_nogex.obs['disease'].str.contains('liver')] ## only 17 cells
## adata_gene = adata_gene[~adata_gene.obs['disease'].str.contains('liver')] ## only 17 cells
## clone_subtype = clone_subtype[clone_subtype['disease'].str.contains('liver')] ## only 17 cells
## adata_nogex.write_h5ad('source/20240131huARdb_v2_GEX.CD8_nob.hvg4k.vae.processed.h5ad')
## adata_gene.write_h5ad('source/20240131huARdb_v2_GEX.CD8.all_genes.h5ad')
## clone_subtype.to_csv('source/20240131clone_subtype.csv')
## R2R
## clone_subtype_exp2 = dominant_sharing_info(clone_subtype, expanded=2)
Part1GEX/TCRfeatures
Functions
## color palette
from colour import Color
from matplotlib.colors import LinearSegmentedColormap
def make_colormap( colors, show_palette = False ):
    color_ramp = LinearSegmentedColormap.from_list( 'my_list', [ Color( c1 ).rgb for c1 in colors ] )
    if show_palette:
        plt.figure( figsize = (15,3))
        plt.imshow( [ list(np.arange(0, len( colors ) , 0.1)) ] , interpolation='nearest', origin='lower', cmap= color_ramp )
        plt.xticks([])
        plt.yticks([])
    return color_ramp
StatsFunctions
def odds_ratio_df(adata=adata_nogex,
                  groupby='meta_cell_subset', groups=meta_cell_subsets,
                  targetby='cell_subtype_3', targets=cell_subtypes,
                  subsets=None):

    tissue_subtype_hm = pd.DataFrame([])
    tissue_subtype_hm.index = targets

    for i in groups:
        condition_subtypes = dict(Counter(adata.obs[
            adata.obs[groupby]==i
        ][targetby]))
        tissue_subtype_hm = pd.concat([tissue_subtype_hm, pd.Series(condition_subtypes, name=str(i))],axis=1)
        tissue_subtype_hm.fillna(0, inplace=True)
        tissue_subtype_hm.astype(int)

    tissue_subtype_hm_odds = pd.DataFrame([])
    tissue_subtype_hm_odds.index = targets
    for jdx, j in enumerate(tissue_subtype_hm.columns):
        tissue_subtype_hm_odds[j+'_odds'] = [
            (
                (int(tissue_subtype_hm.iloc[i,jdx]),
                 int(tissue_subtype_hm.sum(axis=1)[i]-tissue_subtype_hm.iloc[i,jdx])),
                (int(tissue_subtype_hm.sum(axis=0)[j]-tissue_subtype_hm.iloc[i,jdx]),
                int(sum(tissue_subtype_hm.sum(axis=1))-tissue_subtype_hm.iloc[i,jdx]))
            ) for i in range(len(tissue_subtype_hm.sum(axis=1)))]

    if subsets is not None:
        tissue_subtype_odds = tissue_subtype_hm_odds[subsets]
    else:
        tissue_subtype_odds = tissue_subtype_hm_odds
    tissue_subtype_odds = tissue_subtype_odds.applymap(
        lambda x:scipy.stats.contingency.odds_ratio(x).statistic)
    return tissue_subtype_odds

def odds_ratiop_df(adata=adata_nogex,
                  groupby='meta_cell_subset', groups=meta_cell_subsets,
                  targetby='cell_subtype_3', targets=cell_subtypes,
                  subsets=None):

    tissue_subtype_hm = pd.DataFrame([])
    tissue_subtype_hm.index = targets

    for i in groups:
        condition_subtypes = dict(Counter(adata.obs[
            adata.obs[groupby]==i
        ][targetby]))
        tissue_subtype_hm = pd.concat([tissue_subtype_hm, pd.Series(condition_subtypes, name=str(i))],axis=1)
        tissue_subtype_hm.fillna(0, inplace=True)
        tissue_subtype_hm.astype(int)

    tissue_subtype_hm_odds = pd.DataFrame([])
    tissue_subtype_hm_odds.index = targets
    for jdx, j in enumerate(tissue_subtype_hm.columns):
        tissue_subtype_hm_odds[j+'_odds'] = [
            (
                (int(tissue_subtype_hm.iloc[i,jdx]),
                 int(tissue_subtype_hm.sum(axis=1)[i]-tissue_subtype_hm.iloc[i,jdx])),
                (int(tissue_subtype_hm.sum(axis=0)[j]-tissue_subtype_hm.iloc[i,jdx]),
                int(sum(tissue_subtype_hm.sum(axis=1))-tissue_subtype_hm.iloc[i,jdx]))
            ) for i in range(len(tissue_subtype_hm.sum(axis=1)))]

    if subsets is not None:
        tissue_subtype_odds = tissue_subtype_hm_odds[subsets]
    else:
        tissue_subtype_odds = tissue_subtype_hm_odds
    tissue_subtype_odds_p = tissue_subtype_odds.applymap(
        lambda x:scipy.stats.fisher_exact(x))
    return tissue_subtype_odds_p

    ## pval = fisher_exact([[20,380],[6,594]]) ### 计算P值
    ## print(pval)
    ## print(res.confidence_interval(confidence_level=0.95)) ### 计算置信区间
    ## ### ConfidenceInterval(low=2.0736853058122384, high=13.092432304669513)

    ## for i in tissue_subtype_hm.index:
    ##     tissue_subtype_hm.loc[i] = [ x/sum(tissue_subtype_hm.loc[i]) for x in tissue_subtype_hm.loc[i] ]
## D50 stats
def clone_D50(adata, xaxis, xaxis_label, ind=True):
    ## stats
    if ind is True:
        group = 'individual_id'
        threshold = 100
    else:
        group = 'sample_name'
        threshold = 30

    ir.tl.alpha_diversity(adata, groupby=group, target_col='cc_aa_identity',
                          metric='D50', key_added='D50_sample')

    qualified_id = [x for x,y in Counter(adata.obs[group]).items() if y>threshold]
    adata = adata[adata.obs[group].isin(qualified_id)]

    D50_group = adata.obs[[group, 'D50_sample', xaxis_label]].drop_duplicates(subset=group)
    D50_group.index = D50_group[group]

    D50_group[xaxis_label] = D50_group[xaxis_label].astype('category')
    D50_group['D50_sample'] = D50_group['D50_sample'].astype('float')
    D50_group = D50_group.replace(0, np.nan).iloc[:, 1:]

    return D50_group
## Gini index calculation
def gini(wealths):
    cum_wealths = np.cumsum(sorted(np.append(wealths, 0)))
    sum_wealths = cum_wealths[-1]
    xarray = np.array(range(0, len(cum_wealths))) / np.float64(len(cum_wealths) - 1)
    upper = xarray ## 45 angle line
    yarray = cum_wealths / sum_wealths
    B = np.trapz(yarray, x=xarray) ## calculate AUC
    A = 0.5 - B
    G = A / (A + B)
    return G
def clone_gini(adata, xaxis, xaxis_label, ind=True):

    if ind is True:
        group = 'individual_id'
        threshold = 100
    else:
        group = 'sample_name'
        threshold = 50

    qualified_id = [x for x,y in Counter(adata.obs[group]).items() if y>threshold]
    adata = adata[adata.obs[group].isin(qualified_id)]

    clone_gini_df = pd.DataFrame([])
    sample_num = []
    for i in xaxis:
        clone_group = []
        adata_subgroup = adata[adata.obs[xaxis_label]==i]
        sample_subgroup = np.unique(adata_subgroup.obs['individual_id'])
        sample_num.append(len(sample_subgroup))
        for j in sample_subgroup:
            subgroup_sample = adata_subgroup.obs[adata_subgroup.obs['individual_id']==j]
            clone_sample = dict(Counter(subgroup_sample.cc_aa_identity))
            G = gini(list(clone_sample.values()))
            clone_group.append(G)
        clone_gini_df = pd.concat([clone_gini_df, pd.Series(clone_group, index=sample_subgroup)], axis=0)

    conditions = [np.repeat(i,sample_num[idx]) for idx,i in enumerate(xaxis)]
    clone_gini_df[xaxis_label] = [y for x in conditions for y in x ]
    clone_gini_df[0] = clone_gini_df[0].astype(float)

    return clone_gini_df
## circ_tissue cbind df
def cbind_df(adata_circ, adata_tissue, xaxis, xaxis_label, index_type, ind=True):
    if index_type == 'D50':
        df1 = clone_D50(adata_circ, xaxis=xaxis, xaxis_label=xaxis_label, ind=ind)
        df2 = clone_D50(adata_tissue, xaxis=xaxis, xaxis_label=xaxis_label, ind=ind)
    else:
        df1 = clone_gini(adata_circ, xaxis=xaxis, xaxis_label=xaxis_label, ind=ind)
        df2 = clone_gini(adata_tissue, xaxis=xaxis, xaxis_label=xaxis_label, ind=ind)

    df1['origin'] = 'Circulating'
    df2['origin'] = 'Tissue'

    multi_box = pd.concat([df1, df2], axis=0)
    multi_box = multi_box.rename(columns={multi_box.columns[0]: "value", multi_box.columns[1]: "variable"})

    multi_box["variable"] = multi_box["variable"].astype('category')
    multi_box["variable"] = multi_box["variable"].cat.reorder_categories(xaxis)

    return multi_box
PlotsFunctions
## general bar function
def general_bar(data, target_col, ylim0, ylim1, file_name):

    data = data.sort_values(by=target_col, ascending=False)

    width = 0.5
    fig,ax = plt.subplots(figsize=(10,8))

    ax.set_ylabel(target_col)
    ax.set_ylim(ylim0, ylim1)
    ax.bar(range(len(data)),
            [x-ylim0 for x in data[target_col]], bottom=ylim0,
            width=width, align='center', edgecolor=None, color=data['colors'])

    ax.set_xticks(range(len(data)))
    ax.set_xticklabels(data.index, rotation=45, horizontalalignment='right')

    plt.show()
    fig.savefig(file_name)
## stacked_bar function
def stacked_bar(adata, percentage, xitems, xitem_str,
                yitems, yitem_str, *, yitem_color,
                file_name:str):
    ## stats
    stats = []
    for j in yitems:
        cell_num = [len(adata.obs[(adata.obs[yitem_str]==j) &
                                  (adata.obs[xitem_str]==i)])
                    for i in xitems]
        stats.append(cell_num)
    stats = np.array(stats)

    ## plots
    x = range(len(xitems))
    width = 0.35

    fig,ax = plt.subplots(figsize=(10,8))
    bottom_y = np.zeros(len(xitems))

    sums = np.sum(stats, axis=0)
    for idx,i in enumerate(stats):

        if percentage == True:
            y = i / sums ## bar height (percentage)
        else:
            y=i

        ax.bar(x, y, width, bottom=bottom_y, edgecolor=None,
               label=yitems[idx], color=list(yitem_color.values())[idx])
        ## bottom position
        bottom_y = y + bottom_y

    ax.spines['right'].set_visible(False)
    ax.spines['top'].set_visible(False)

    plt.xticks(x, xitems)
    plt.legend(bbox_to_anchor=(1.3, 0.5), loc='center right')
    fig.autofmt_xdate(rotation=45)

    fig.savefig(file_name)
    plt.show()
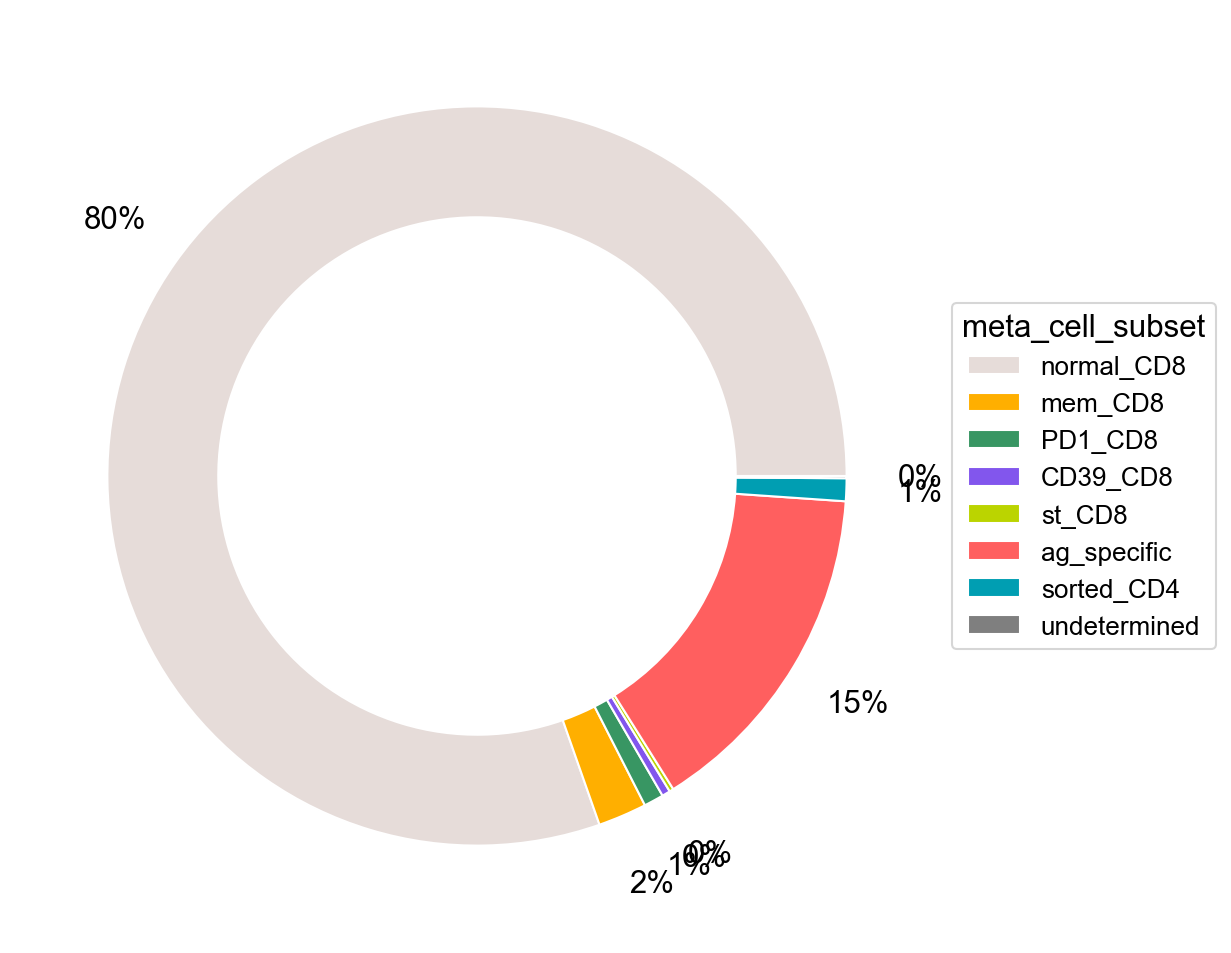
## pie_plot function
def pie_plot(adata, items, item_str, item_color, file_name):
    ## SupFigure1BR
    ## stats
    requested_percent = [len(adata.obs[(adata.obs[item_str]==i)]) for i in items]
    requested_percent = np.array(requested_percent)

    ## plots
    fig, ax = plt.subplots(figsize=(10,8))
    ax.pie(requested_percent, radius=1,
           colors=item_color.values(),
           autopct='%1.0f%%', pctdistance=1.2,
           wedgeprops=dict(width=0.3, edgecolor='w'))

    ax.legend(items,
              title=item_str,
              loc="center left",
              fontsize="small",
              bbox_to_anchor=(1,0,0.5,1))

    fig.savefig(file_name)
    plt.show()
## multi boxplot
def multi_boxplot(multi_box, file_name,
                  xaxis='variable', yaxis='value', hueaxis='origin',
                  palette_list=disease_type_color.values()):

    fig,ax = plt.subplots(figsize=(10,8))

    sns.boxplot(x=xaxis, y=yaxis, hue=hueaxis, data=multi_box,
                palette=palette_list,
                linewidth=0.5, boxprops={"zorder":2},
                showfliers=False, ax=ax)

    num = len(multi_box[hueaxis].unique())
    ## Extract x and y coordinates of the dots
    sns.stripplot(x=xaxis, y=yaxis, hue=hueaxis,
                  palette=palette_list, jitter=True,
                  size=5,
                  linewidth=1, edgecolor='black',
                  dodge=0.5 / num * (num - 1),
                  data=multi_box, ax=ax)

    ax.spines['right'].set_visible(False)
    ax.spines['top'].set_visible(False)

    plt.legend(bbox_to_anchor=(1.3, 0.5), loc='center right')
    fig.autofmt_xdate(rotation=45)

    fig.savefig(file_name)
    plt.show()
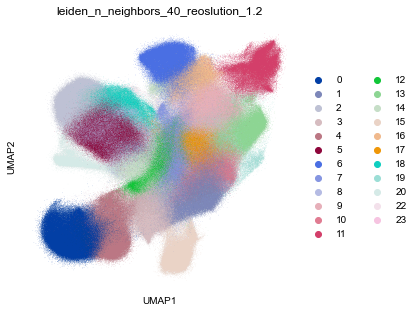
MainFigure2
## Leiden
fig,ax = plt.subplots(figsize=(5,5))
sc.pl.umap(adata_nogex, color='leiden_n_neighbors_40_reoslution_1.2', size=0.5, ax=ax)
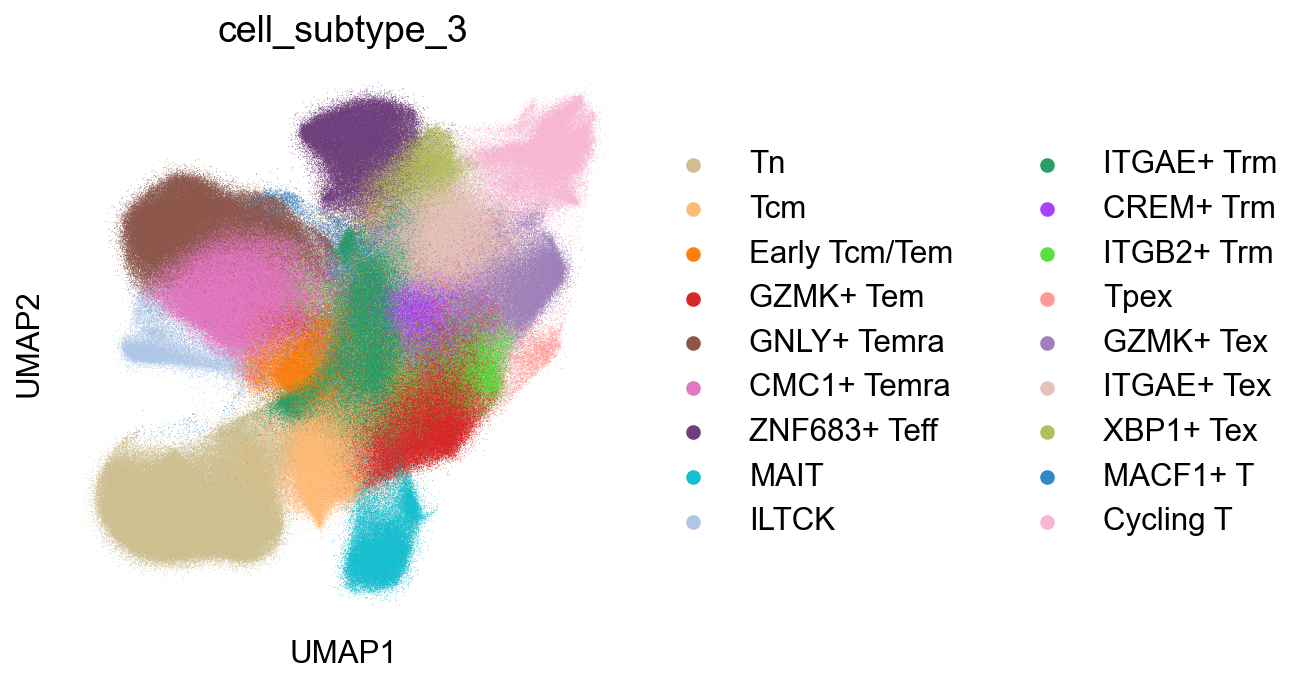
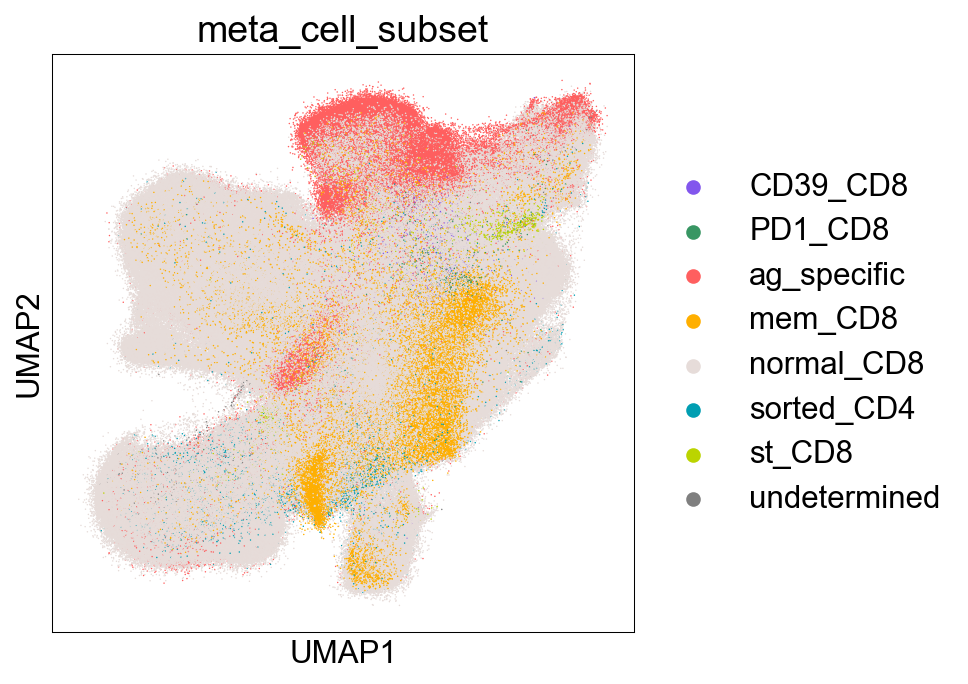
CellSubtypes
## Cell subtype UMAP, Figure1B
setPltLinewidth(0)
plt.rcParams.update(plt.rcParamsDefault)
plt.rcParams['figure.dpi'] = 150
plt.rcParams['savefig.dpi'] = 150
plt.rcParams['font.size'] = 15
plt.rcParams['axes.linewidth'] = 0
plt.rcParams['font.family'] = "Arial"
mpl.rcParams['pdf.fonttype'] = 42
mpl.rcParams['ps.fonttype'] = 42

fig,ax = plt.subplots(figsize=(5,5))
sc.pl.umap(adata_nogex, color='cell_subtype_3', size=0.5,
           ax=ax, palette=subtype_color)
fig.savefig('figures/Figure2A_cell_subtype.png')
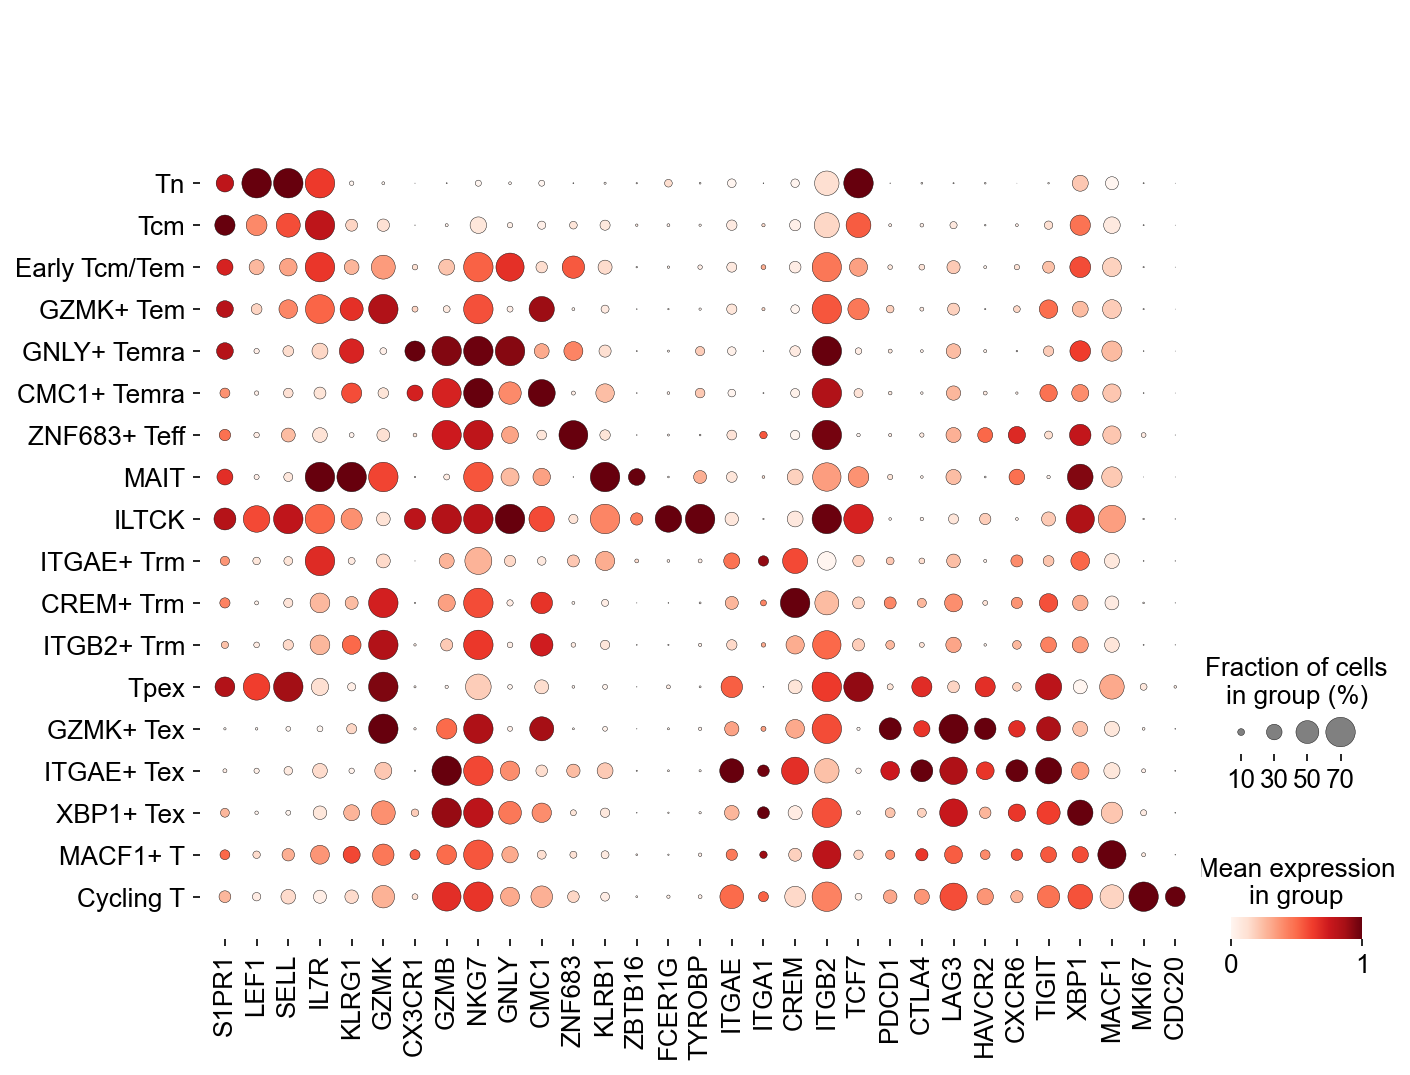
## Cell subtype marker, Figure1C
## Cell subtype marker, Figure1C
fig,ax = plt.subplots(figsize=(10,8))
sc.pl.dotplot(adata_gene, var_names=['S1PR1', 'LEF1', 'SELL', 'IL7R',
                                     'KLRG1', 'GZMK', 'CX3CR1', 'GZMB', 'NKG7',
                                     'GNLY', 'CMC1', 'ZNF683',
                                     'KLRB1', 'ZBTB16', 'FCER1G', 'TYROBP',
                                     'ITGAE', 'ITGA1', 'CREM', 'ITGB2',
                                     'TCF7', 'PDCD1', 'CTLA4',
                                     'LAG3', 'HAVCR2',
                                     'CXCR6', 'TIGIT', 'XBP1',
                                     'MACF1', 'MKI67', 'CDC20'],
              groupby='cell_subtype_3', dot_max=0.7, ax=ax,
              standard_scale='var')
fig.savefig('figures/Figure2B_marker_genes.pdf')
TCR-repertoire Features
## D50 cc_aa_identity, Figure1E
kid_studies = ['Wang_2021a', 'Ramaswamy_2021']
old_sname = ['F020', 'F021', 'F023', 'OH14', 'OH15', 'OH17']
young_sname = ['F016', 'F017', 'F024']

adata_circ_nokid = adata_circ[~adata_circ.obs['study_name'].isin(kid_studies)]
adata_circ_nokid = adata_circ_nokid[~adata_circ_nokid.obs['sample_name'].isin(old_sname+young_sname)]

adata_tissue_TIL_nokid = adata_tissue_TIL[~adata_tissue_TIL.obs['study_name'].isin(kid_studies)]

adata_circ_nokid = adata_circ_nokid[adata_circ_nokid.obs['meta_cell_subset']=='normal_CD8']
adata_tissue_TIL_nokid = adata_tissue_TIL_nokid[adata_tissue_TIL_nokid.obs['meta_cell_subset']=='normal_CD8']
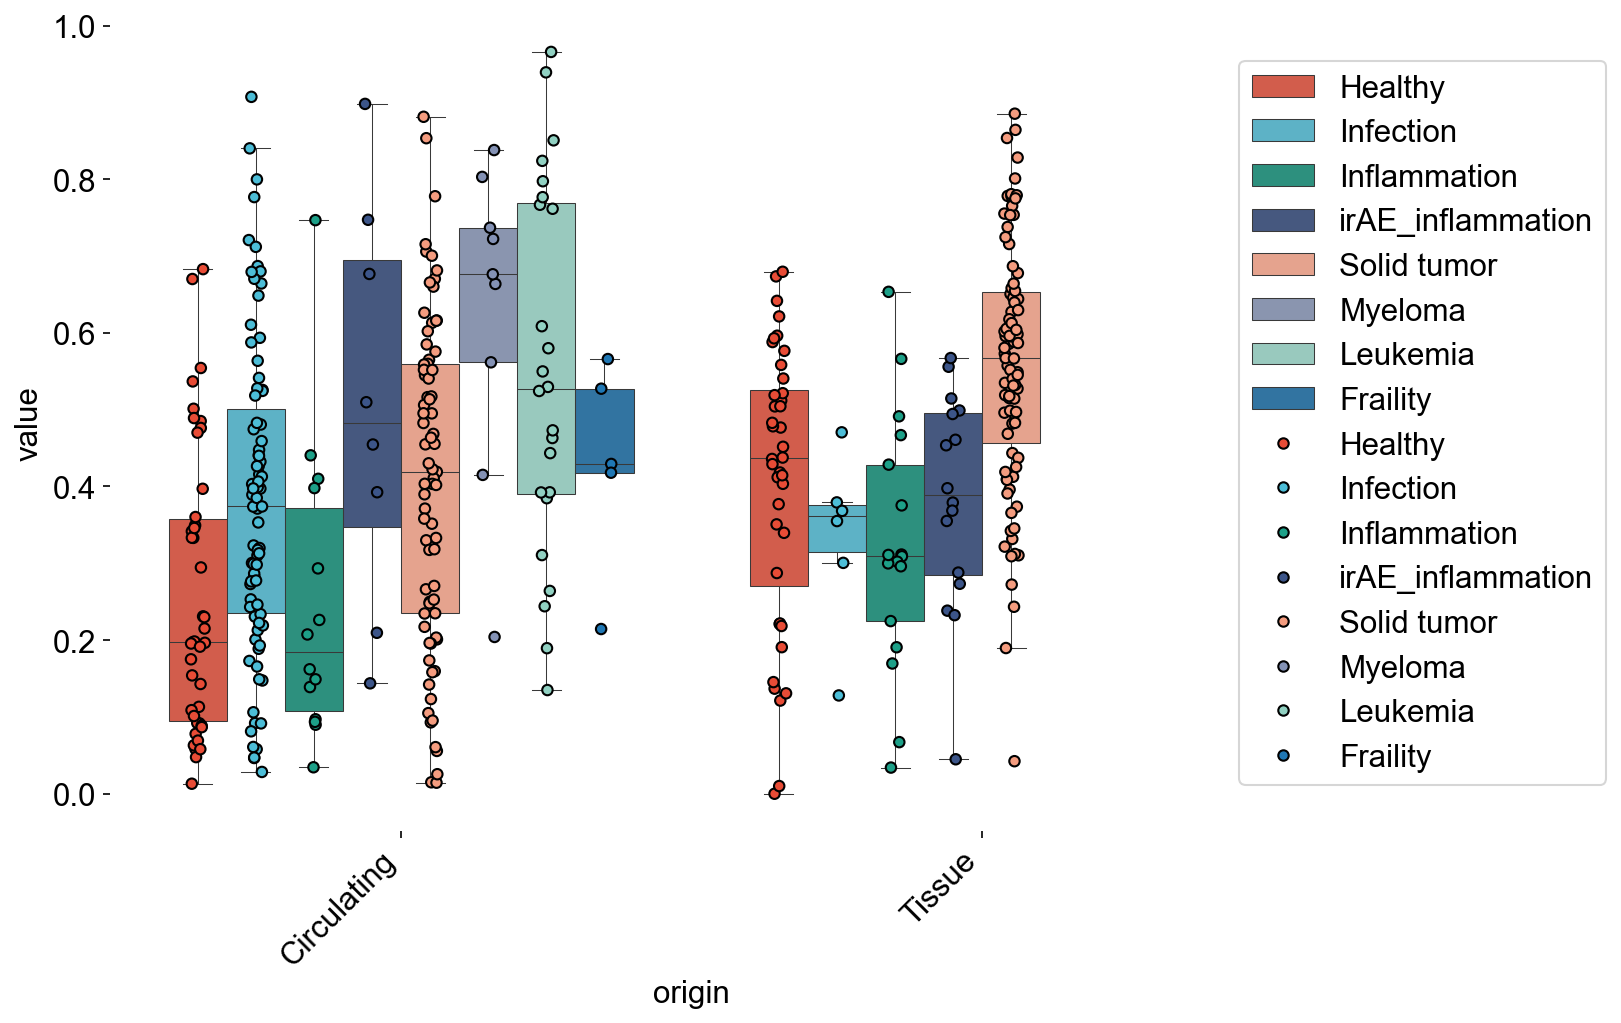
d50_disease = cbind_df(adata_circ_nokid, adata_tissue_TIL_nokid,
                       xaxis=disease_types, xaxis_label='disease_type', index_type='D50')

multi_boxplot(d50_disease,
              xaxis='origin', yaxis='value', hueaxis='variable',
              file_name='source/d50_disease.pdf')
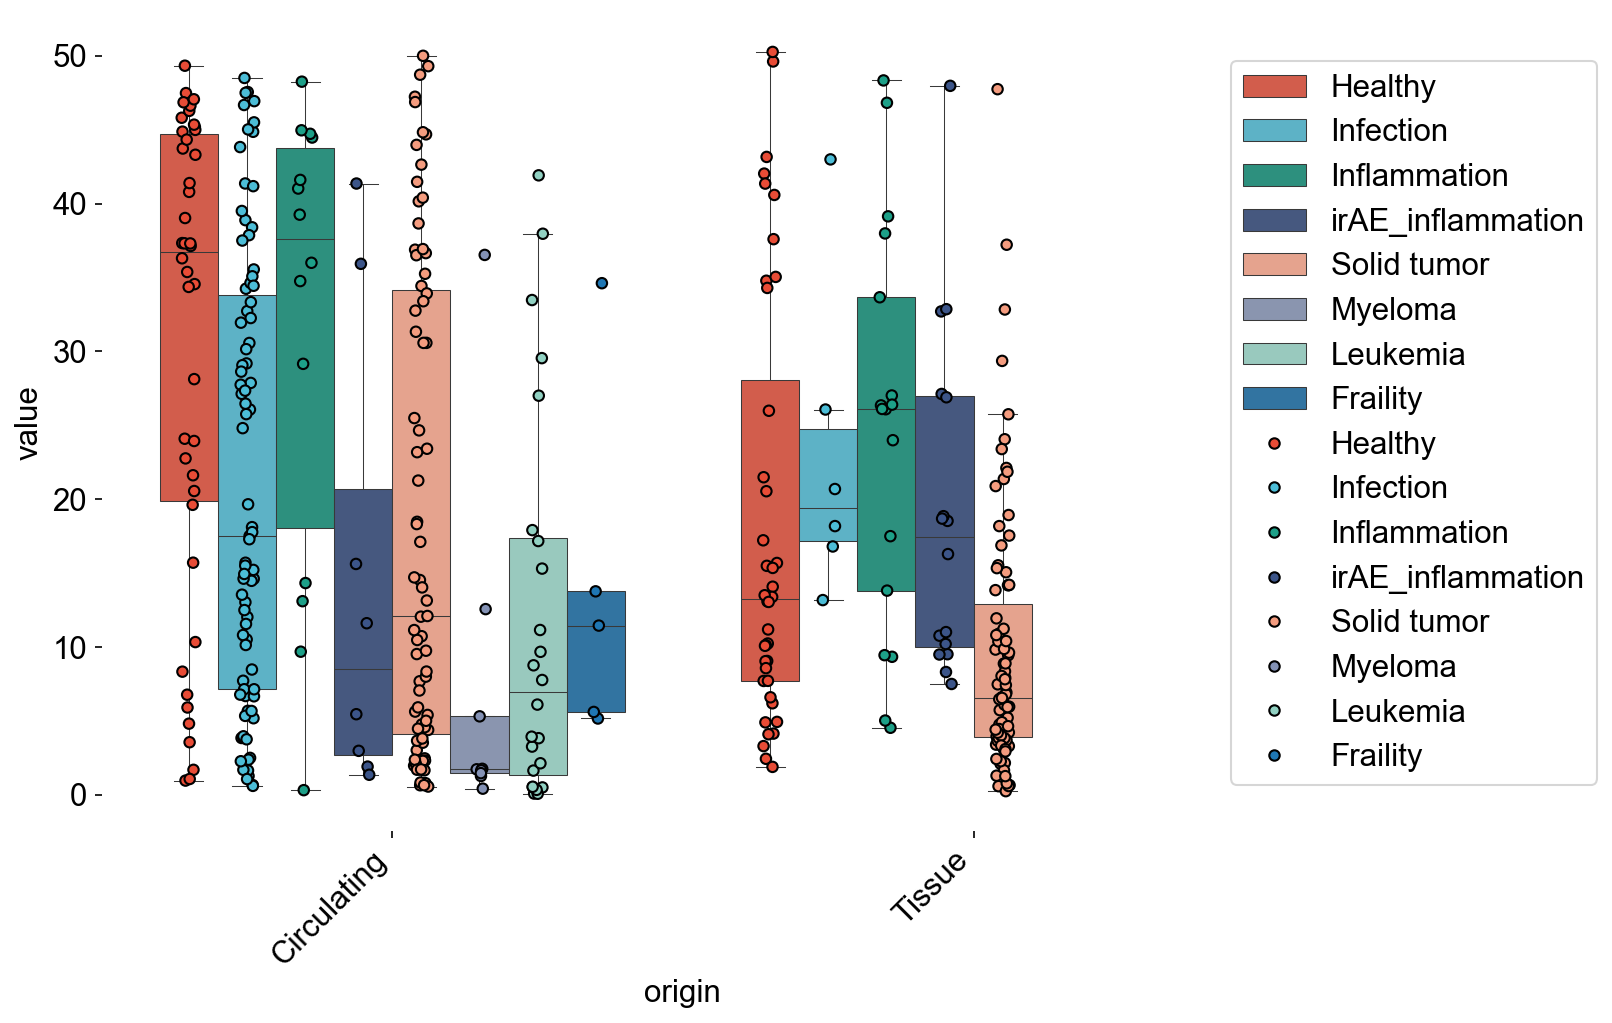
Counter(d50_disease[d50_disease['origin']=='Circulating']['variable'])
Counter({'Healthy': 42,
         'Fraility': 5,
         'Solid tumor': 75,
         'Infection': 83,
         'Inflammation': 14,
         'Leukemia': 24,
         'Myeloma': 9,
         'irAE_inflammation': 8})
d50_disease_circ = d50_disease[d50_disease['origin']=='Circulating']
d50_disease_tissue = d50_disease[d50_disease['origin']=='Tissue']
stats.mannwhitneyu(d50_disease_circ[d50_disease_circ['variable']=='Healthy'].value,
                   d50_disease_circ[d50_disease_circ['variable']=='Fraility'].value)
MannwhitneyuResult(statistic=163.0, pvalue=0.04483359507777036)
## Figure1F, stats of circos plot
clone_cross = clone_subtype[(clone_subtype['study_name'].isin(circ_tissue))]
general_share = dict(Counter(clone_cross['sharing_type']))
general_share_df = pd.DataFrame.from_dict(general_share, orient='index')
general_share_df = general_share_df[general_share_df[0]>=5]
general_share_df.to_csv('figures/Figure2i.csv')
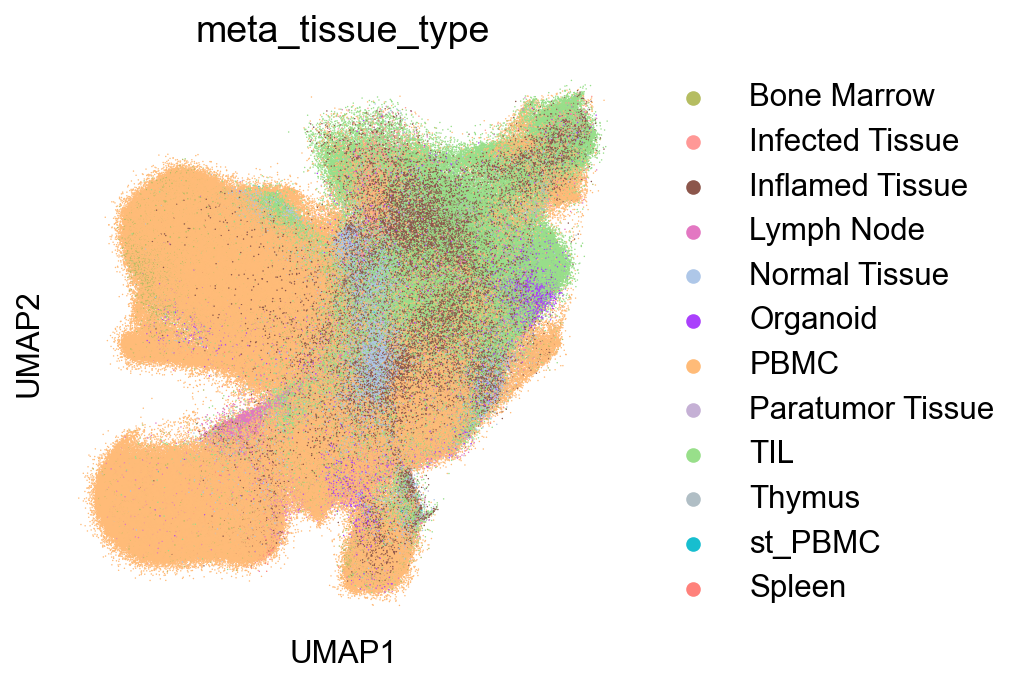
SourceDistribution
adata_nmal = adata_nogex[adata_nogex.obs['meta_cell_subset']=='normal_CD8']
## figure1f
fig,ax = plt.subplots(figsize=(5,5))
sc.pl.umap(adata_nmal, color='meta_tissue_type',
           palette=tissue_type_color, size=2, ax=ax)
fig.savefig('figures/meta_tissue_type.png')
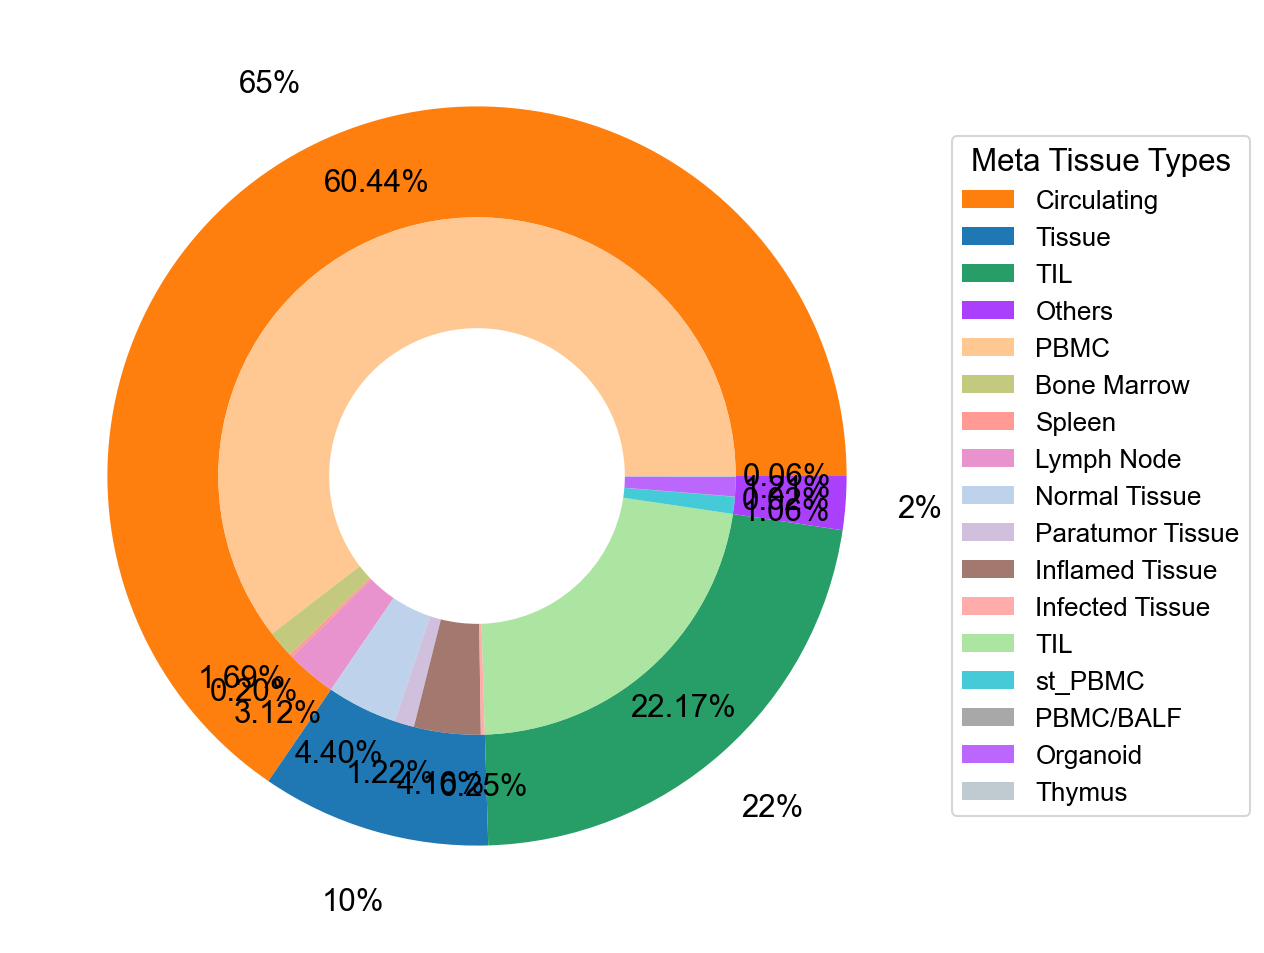
## Supfigure1g, pie chart
tissue_subpercent = []
for j in meta_tissue_type_aggrs:
    cell_num = [len(adata_nmal.obs[(adata_nmal.obs['meta_tissue_type_aggr']==j) &
                                   (adata_nmal.obs['meta_tissue_type']==i)]) for i in meta_tissue_types]
    tissue_subpercent.append(cell_num)
tissue_subpercent = np.array(tissue_subpercent)

fig,ax = plt.subplots(figsize=(10,8))
color_map = meta_tissue_type_color.values()
inner_color_map = tissue_type_color.values()

ax.pie(tissue_subpercent.sum(axis=1), radius=1,
       colors=color_map,
       autopct='%1.0f%%', pctdistance=1.2,
       wedgeprops=dict(width=0.3))

ax.pie(tissue_subpercent.flatten()[tissue_subpercent.flatten()!=0], radius=0.7,
       colors=inner_color_map,
       autopct='%1.2f%%', pctdistance=1.2,
       wedgeprops=dict(width=0.3, alpha=0.8))

ax.legend(list(meta_tissue_type_color.keys())+list(tissue_type_color.keys()),
          title="Meta Tissue Types",
          loc="center left",
          fontsize="small",
          bbox_to_anchor=(1,0,0.5,1))
fig.savefig('figures/tissue_subpercent.pdf')
plt.show()
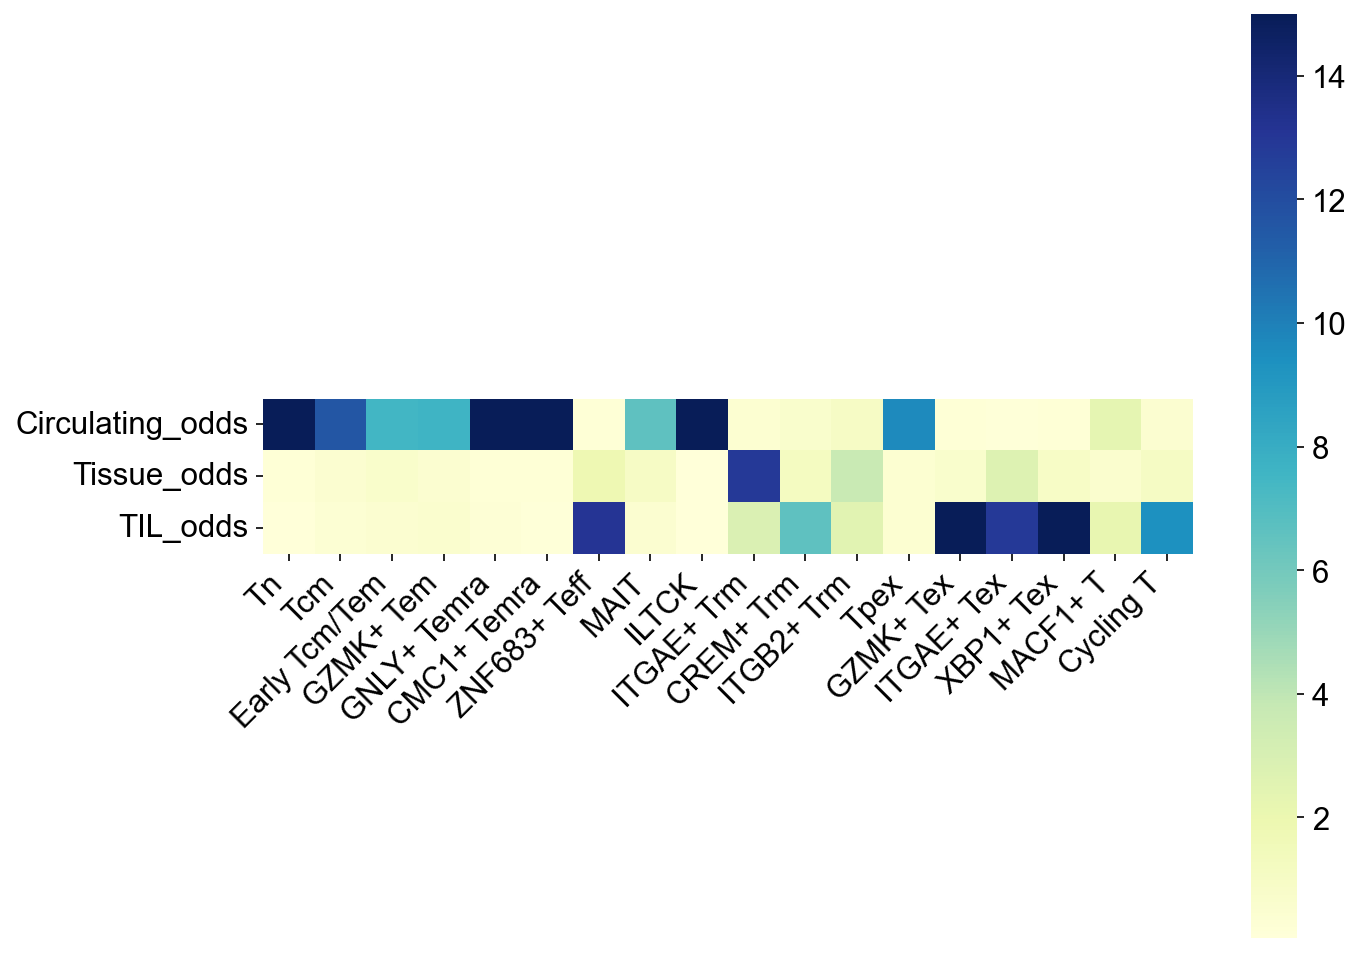
## Figure2H
tissue_subtype_odds = odds_ratio_df(
    adata=adata_nmal,
    groupby='meta_tissue_type_aggr', groups=meta_tissue_type_aggrs[:3])
fig,ax = plt.subplots(figsize=(10,8))
ax = sns.heatmap(tissue_subtype_odds.T, square=True, cmap='YlGnBu', vmax=15)
ax.set_xticklabels(ax.get_xticklabels(), rotation=45, horizontalalignment='right')

fig.savefig('figures/Figure2e_subtype_odds.pdf')
plt.show()
SupTables
## stats
adata_nogex.uns['log1p']['base'] = None
sc.tl.rank_genes_groups(adata_nogex, groupby='cell_subtype_3')
WARNING: Default of the method has been changed to 't-test' from 't-test_overestim_var'
subtype_sheet_names = [
    'Tn',
    'Tcm',
    'EarlyTcmTem',
    'GZMK+Tem',
    'GNLY+Temra',
    'CMC1+Temra',
    'ZNF683+Teff',
    'MAIT',
    'ILTCK',
    'ITGAE+Trm',
    'CREM+Tm',
    'ITGB2+Trm',
    'Tpex',
    'GZMK+Tex',
    'ITGAE+Tex',
    'XBP1+Tex',
    'MACF1+T',
    'CyclingT'
]
with pd.ExcelWriter('tables/marker_genes.xls') as marker_excel:
    for i,j in zip(cell_subtypes,subtype_sheet_names):
        subtype_marker = sc.get.rank_genes_groups_df(adata_nogex, group=i)
        subtype_marker = subtype_marker[~subtype_marker['names'].str.startswith('RP') &
                                        ~subtype_marker['names'].str.startswith('MT-')]
        subtype_marker.to_excel(marker_excel, sheet_name=j, index=False)
sample_info = adata_nogex.obs.drop_duplicates(subset='sample_name')
sample_info.index = sample_info['sample_name']
sample_info['cell_num'] = Counter(adata_nogex.obs['sample_name'])
sample_info = sample_info[['study_name','individual_id',
                           'meta_tissue_type','meta_tissue_type_aggr',
                           'cell_subset','meta_cell_subset','disease','disease_type',
                           'treatment', 'treatment_status', 'donor_sex','donor_age']]
sample_info = sample_info.sort_values(['study_name', 'sample_name', 'meta_tissue_type_aggr'])
sample_info.to_excel('tables/sample_info.xls', index=True)
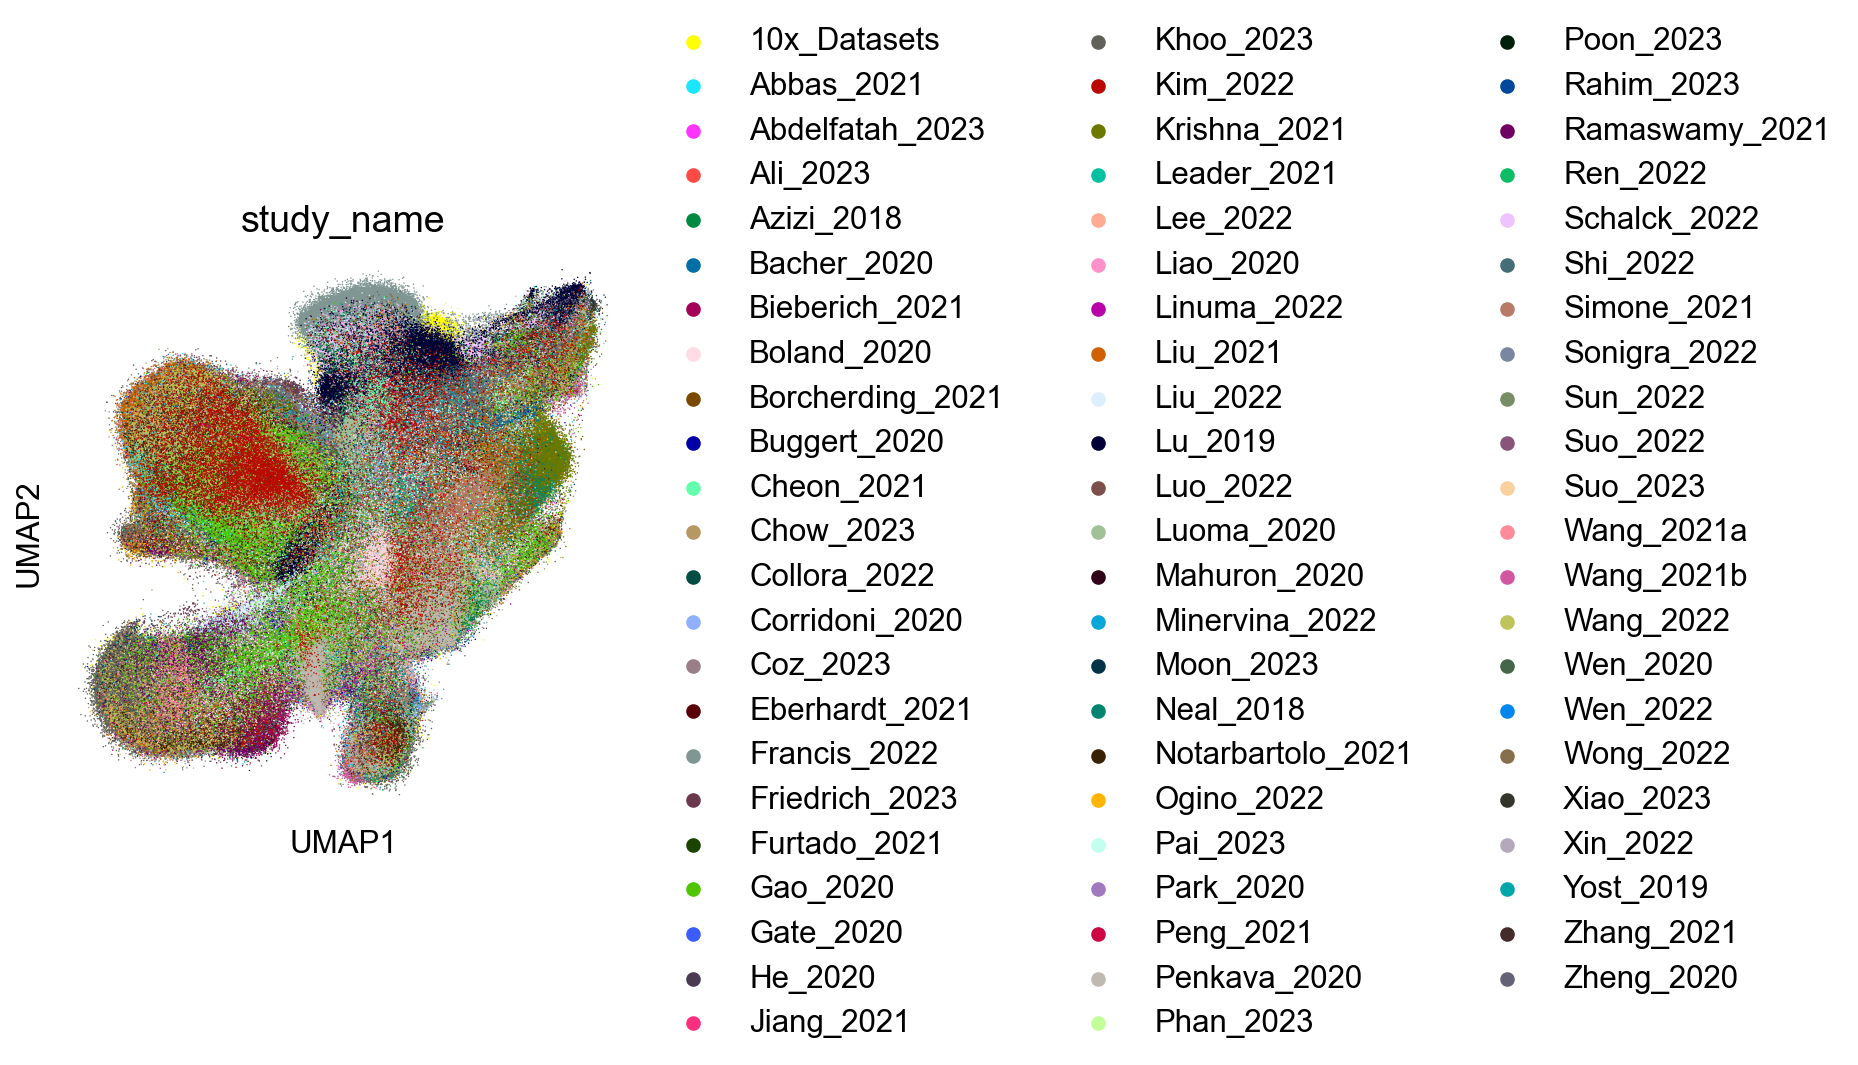
SupFigure7
Extended Data Figure 7A
## Supfigure1A
fig,ax = plt.subplots(figsize=(5,5))
sc.pl.umap(adata_nogex, color='study_name', size=2, ax=ax)
fig.savefig('figures/S7A_study_name.png')
Extended Data Figure 7B-D (Sorting)
fig,ax = plt.subplots(figsize=(5,5))
sc.pl.umap(adata_nogex, color='meta_cell_subset', size=2,
           palette=sorting_color, ax=ax)
fig.savefig('figures/S7B_meta_cell_subset.png')
pie_plot(adata_nogex,
         items=meta_cell_subsets,
         item_str='meta_cell_subset',
         item_color=sorting_color,
         file_name='figures/S7_subset_percent.pdf')
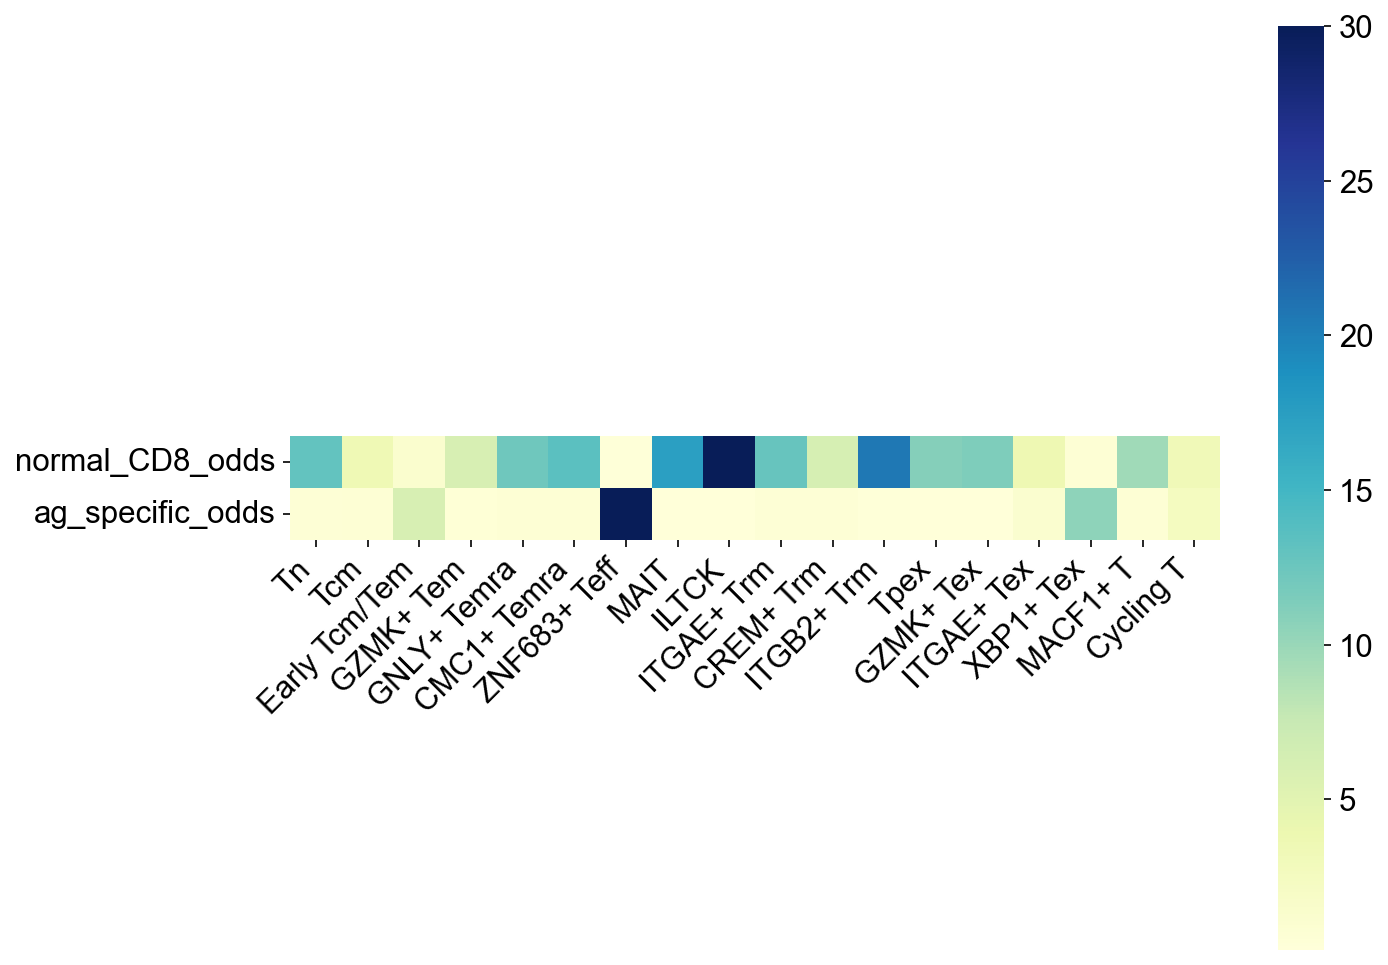
facs_subset = ['normal_CD8_odds', 'ag_specific_odds',]
facs_odds = odds_ratio_df(groupby='meta_cell_subset', groups=meta_cell_subsets,subsets=facs_subset)
fig,ax = plt.subplots(figsize=(10,8))
ax = sns.heatmap(facs_odds.T, square=True, cmap='YlGnBu', vmax=30)
ax.set_xticklabels(ax.get_xticklabels(), rotation=45, horizontalalignment='right')
fig.savefig('figures/S7_cell_subset_odds.pdf')
plt.show()
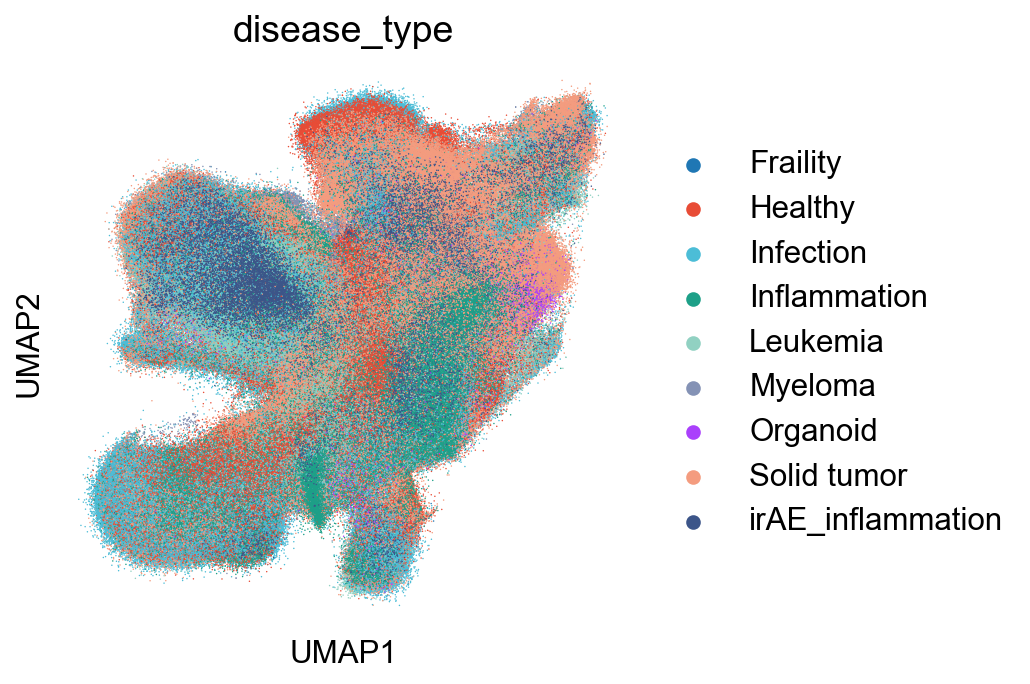
Extended Data Figure 7E-G (Disease)
## Supfigure1D
fig,ax = plt.subplots(figsize=(5,5))
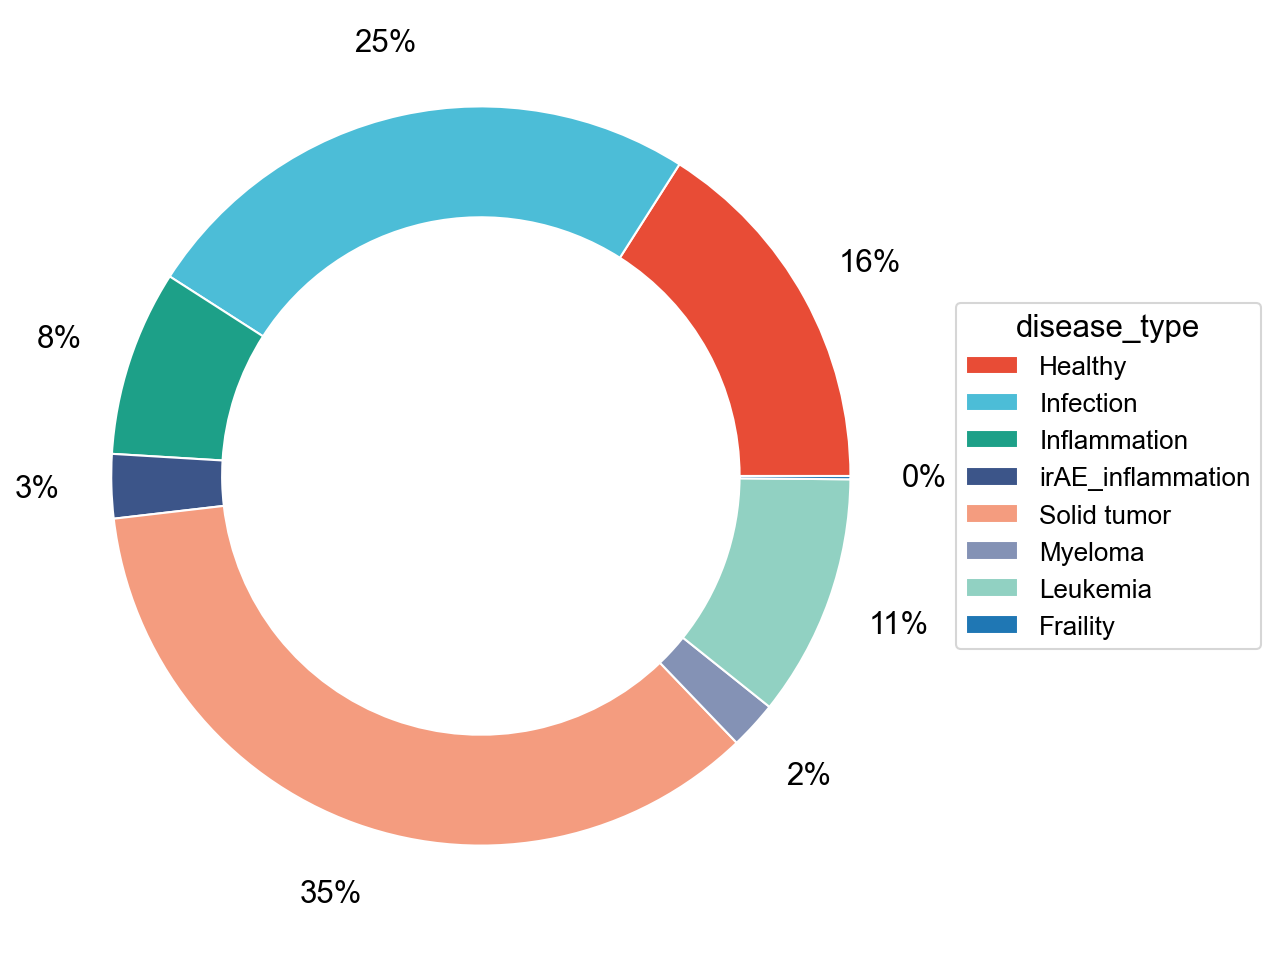
sc.pl.umap(adata_nogex, color='disease_type', palette=disease_type_color, size=2, ax=ax)
fig.savefig('figures/S7_disease_type.pdf')
## Supfigure1D
pie_plot(adata_nogex,
         items=disease_types,
         item_str='disease_type',
         item_color=disease_type_color,
         file_name='figures/S7_condition_percent.pdf')
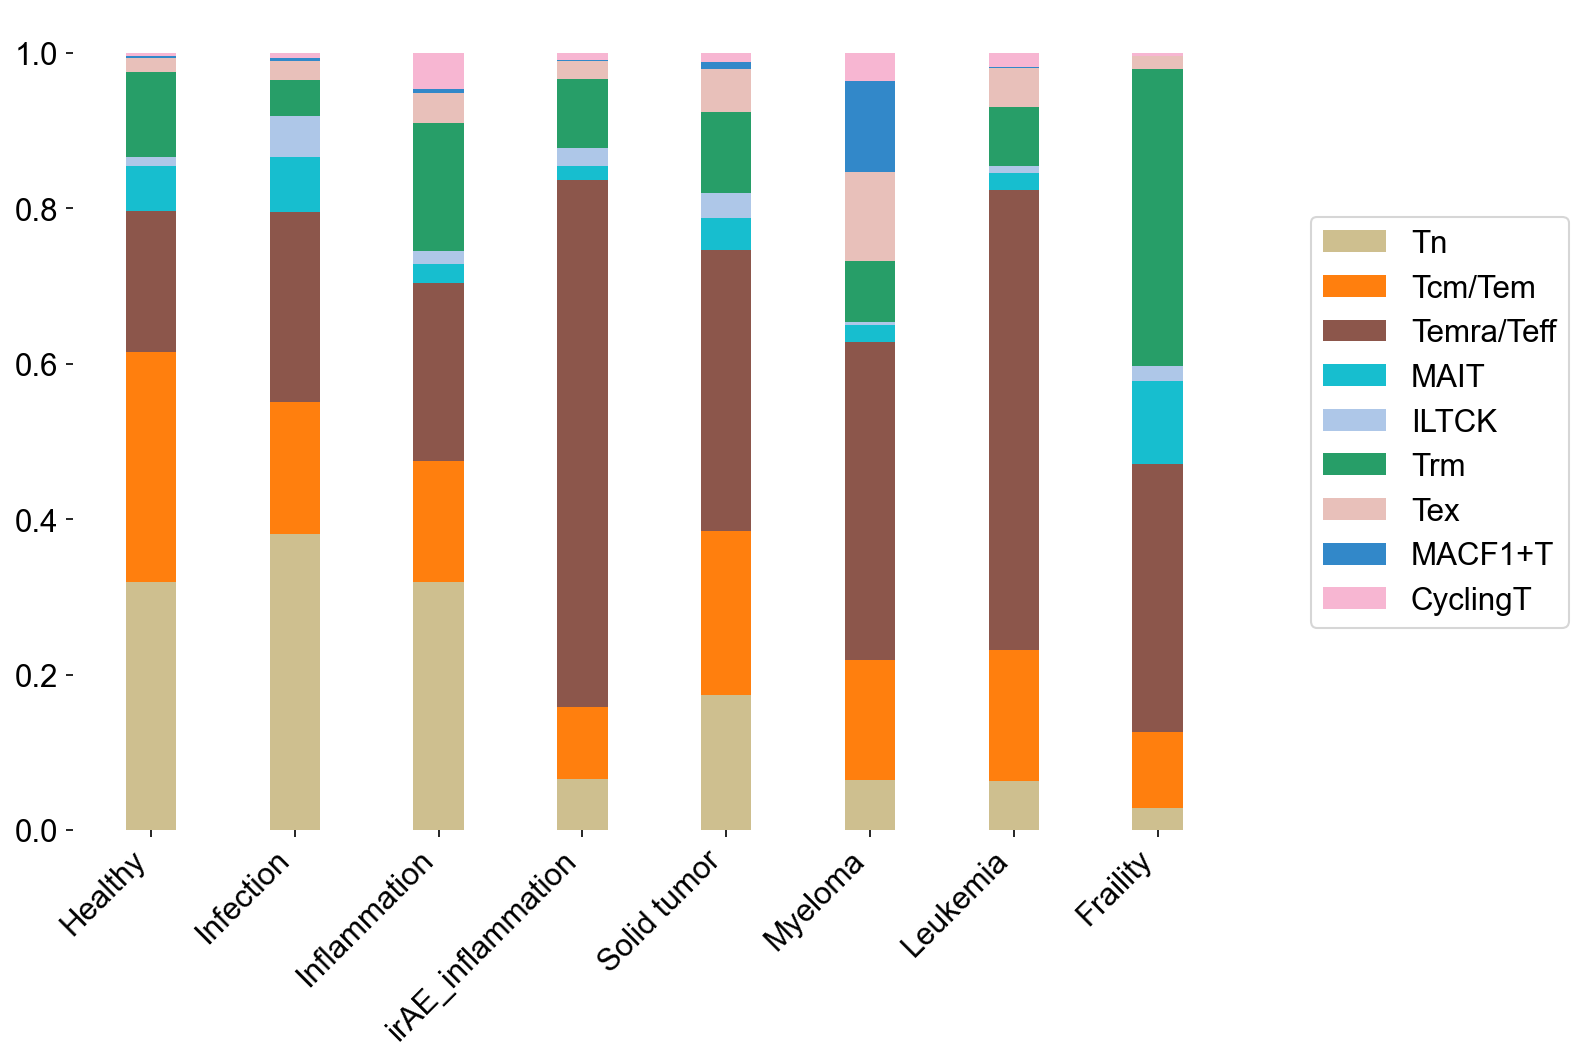
stacked_bar(adata=adata_circ_nokid[adata_circ_nokid.obs['meta_cell_subset']=='normal_CD8'],
            percentage=True, xitems=disease_types, xitem_str='disease_type',
            yitems=cell_subtype_aggrs, yitem_str='meta_cell_subtype', yitem_color=main_type_color,
            file_name='figures/S7_disease2subtypes_circ.pdf')
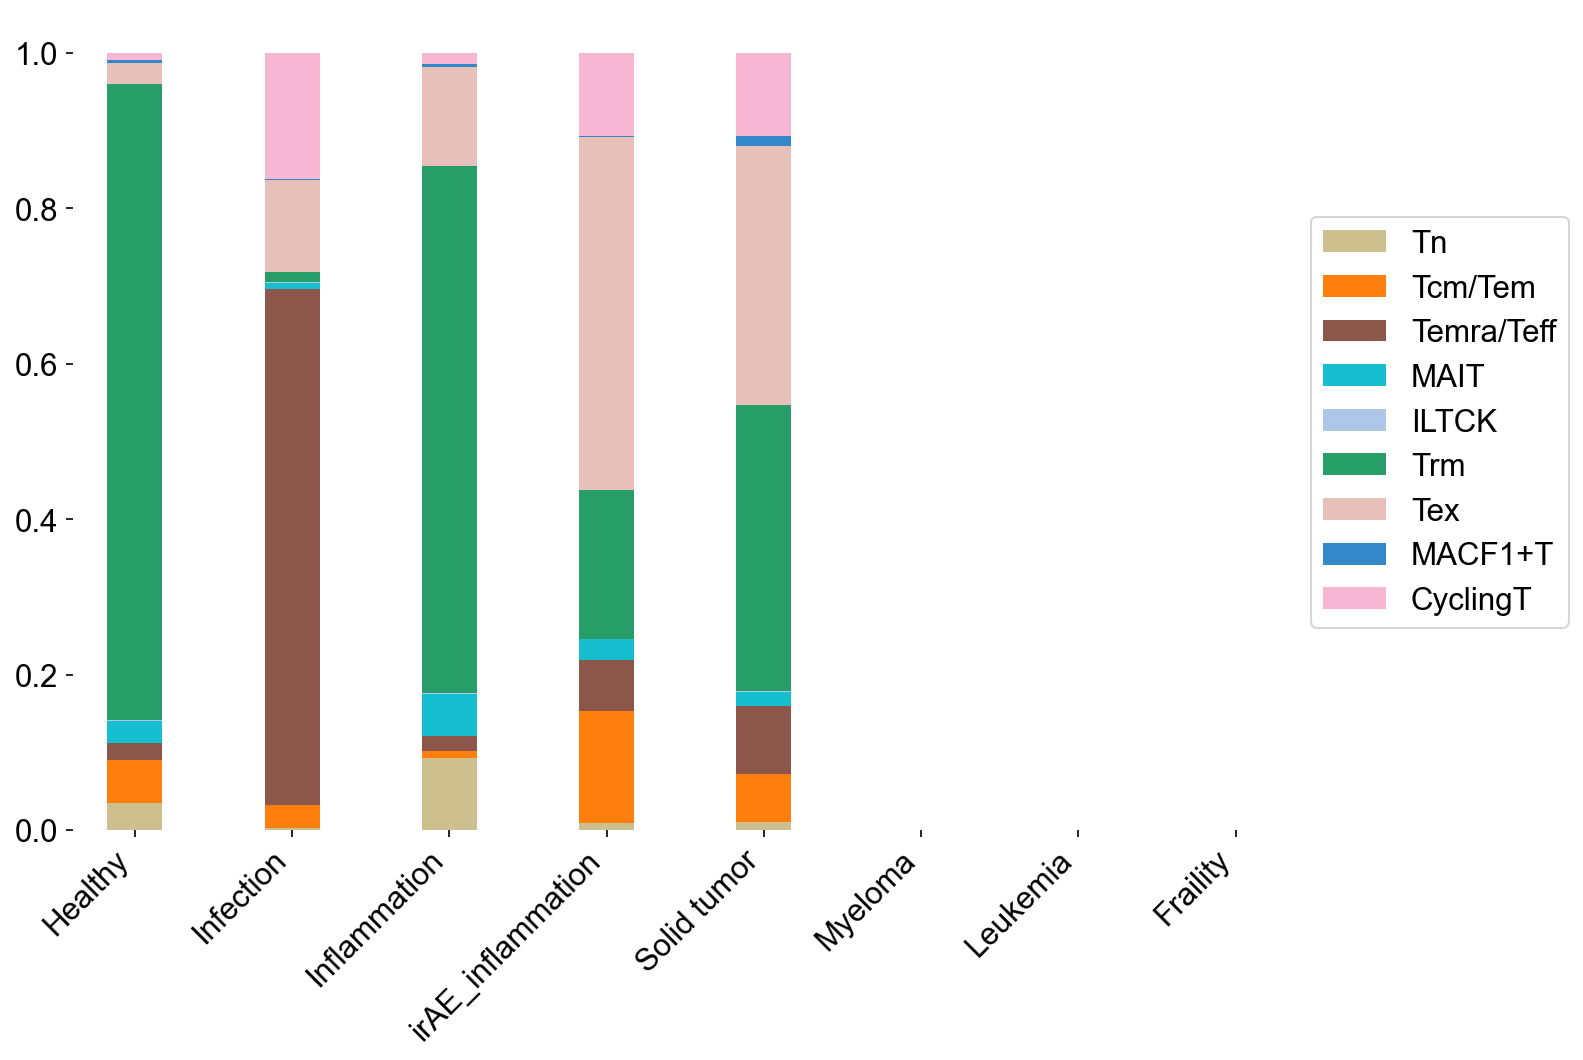
stacked_bar(adata=adata_tissue_TIL_nokid[adata_tissue_TIL_nokid.obs['meta_cell_subset']=='normal_CD8'],
            percentage=True, xitems=disease_types, xitem_str='disease_type',
            yitems=cell_subtype_aggrs, yitem_str='meta_cell_subtype', yitem_color=main_type_color,
            file_name='figures/S7_disease2subtypes_tissue.pdf')
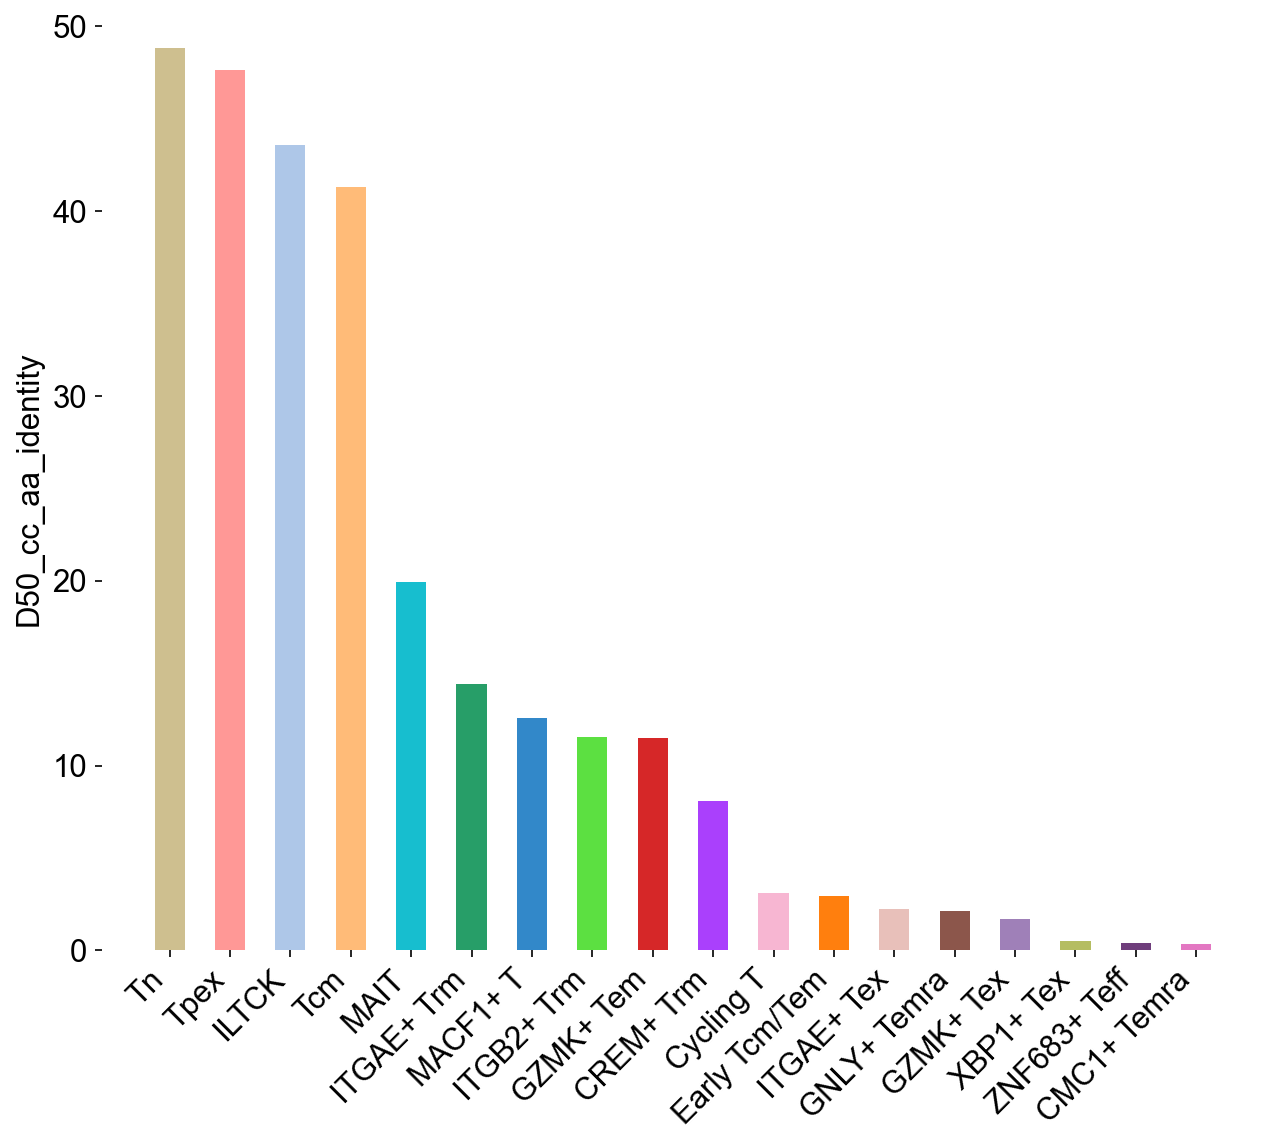
## SupFigureS6G
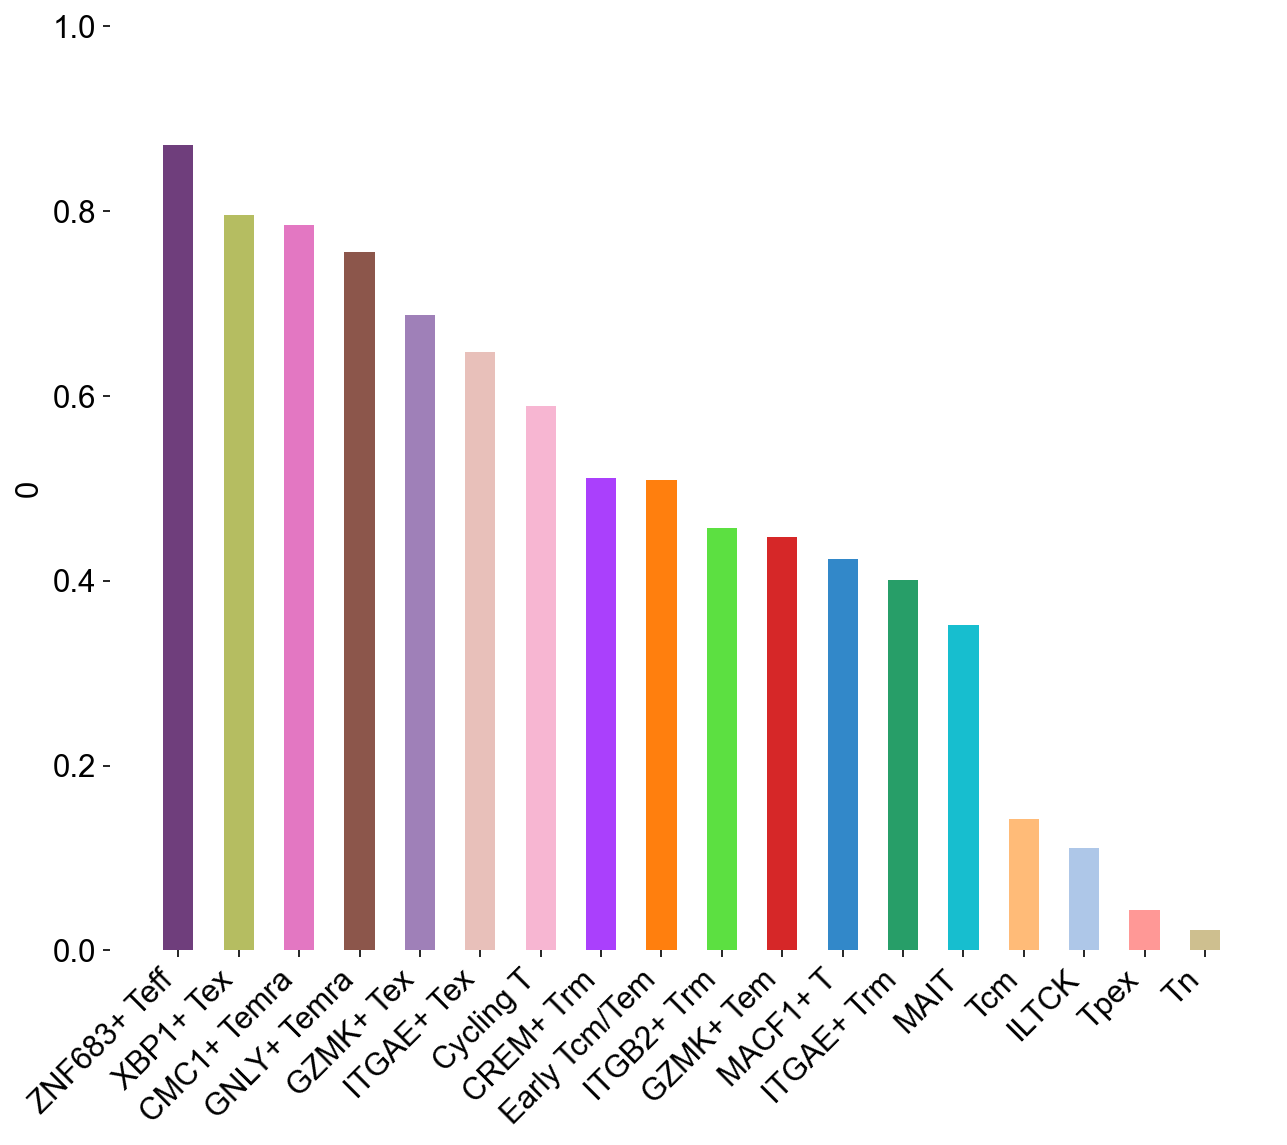
ir.tl.alpha_diversity(adata_nogex, groupby='cell_subtype_3', target_col='cc_aa_identity', metric='D50')
adata_nogex.obs['D50_cc_aa_identity'] = adata_nogex.obs['D50_cc_aa_identity'].astype(float)
D50_subtypes = adata_nogex.obs[['cell_subtype_3','D50_cc_aa_identity']].drop_duplicates(subset='cell_subtype_3')
D50_subtypes.index = D50_subtypes['cell_subtype_3']
D50_subtypes = D50_subtypes.reindex(cell_subtypes)
D50_subtypes['colors'] = subtype_color.values()
general_bar(D50_subtypes, target_col='D50_cc_aa_identity', ylim0=0, ylim1=50,
file_name='figures/S7_d50_subtype.pdf')
## SupFigureS6H
clone_group=[]
for i in cell_subtypes:
    subgroup_sample = adata_nogex.obs[adata_nogex.obs['cell_subtype_3']==i]
    clone_sample = dict(Counter(subgroup_sample.cc_aa_identity))
    G = gini(list(clone_sample.values()))
    clone_group.append(G)
clone_gini_df = pd.DataFrame(clone_group, index=cell_subtypes)
clone_gini_df['colors'] = subtype_color.values()
general_bar(clone_gini_df, target_col=0, ylim0=0, ylim1=1,
            file_name='figures/S7_gini_subtype.pdf')
## SupFigureS6I
gini_disease = cbind_df(adata_circ_nokid, adata_tissue_TIL_nokid,
                        xaxis=disease_types, xaxis_label='disease_type', index_type='gini')
multi_boxplot(gini_disease, xaxis='origin', hueaxis='variable',
              file_name='figures/S7_gini_disease.pdf')
gini_disease_circ = gini_disease[gini_disease['origin']=='Circulating']
gini_disease_tissue = gini_disease[gini_disease['origin']=='Tissue']
stats.mannwhitneyu(gini_disease_circ[gini_disease_circ['variable']=='Healthy'].value,
                   gini_disease_circ[gini_disease_circ['variable']=='Fraility'].value)
MannwhitneyuResult(statistic=44.0, pvalue=0.033829246143425515)
Part2TwoTypeTexInCancer
Functions
## blacklist genes which may be affected by dissociation
blacklist = [
    "ACTG1",
    "BTG1",
    "CXCL1",
    "DNAJB4",
    "ERRFI1",
    "H3F3B",
    "HSPB1",
    "IRF1",
    "KLF6",
    "MIR22HG",
    "NFKBIA",
    "PCF11",
    "PXDC1",
    "SDC4",
    "SRF",
    "TPM3",
    "USP2",
    "GADD45G",
    "ANKRD1",
    "BTG2",
    "CYR61",
    "DUSP1",
    "FAM132B",
    "HIPK3",
    "HSPH1",
    "IRF8",
    "KLF9",
    "MT1",
    "NFKBIZ",
    "PDE4B",
    "RAP1B",
    "SERPINE1",
    "SRSF5",
    "TPPP3",
    "WAC",
    "HSPE1",
    "ARID5A",
    "CCNL1",
    "DCN",
    "DUSP8",
    "FOS",
    "HSP90AA1",
    "ID3",
    "ITPKC",
    "LITAF",
    "MT2",
    "NOP58",
    "PER1",
    "RASSF1",
    "SKIL",
    "SRSF7",
    "TRA2A",
    "ZC3H12A",
    "IER5",
    "ATF3",
    "CCRN4L",
    "DDX3X",
    "EGR1",
    "FOSB",
    "HSP90AB1",
    "IDI1",
    "JUN",
    "LMNA",
    "MYADM",
    "NPPC",
    "PHLDA1",
    "RHOB",
    "SLC10A6",
    "STAT3",
    "TRA2B",
    "ZFAND5",
    "KCNE4",
    "ATF4",
    "CEBPB",
    "DDX5",
    "EGR2",
    "FOSL2",
    "HSPA1A",
    "IER2",
    "JUNB",
    "MAFF",
    "MYC",
    "NR4A1",
    "PNP",
    "RHOH",
    "SLC38A2",
    "TAGLN2",
    "TRIB1",
    "ZFP36",
    "BAG3",
    "CEBPD",
    "DES",
    "EIF1",
    "GADD45A",
    "HSPA1B",
    "IER3",
    "JUND",
    "MAFK",
    "MYD88",
    "ODC1",
    "PNRC1",
    "RIPK1",
    "SLC41A1",
    "TIPARP",
    "TUBB4B",
    "ZFP36L1",
    "BHLHE40",
    "CEBPG",
    "DNAJA1",
    "EIF5",
    "GCC1",
    "HSPA5",
    "IFRD1",
    "KLF2",
    "MCL1",
    "NCKAP5L",
    "OSGIN1",
    "PPP1CC",
    "SAT1",
    "SOCS3",
    "TNFAIP3",
    "TUBB6",
    "ZFP36L2",
    "BRD2",
    "CSRNP1",
    "DNAJB1",
    "ERF",
    "GEM",
    "HSPA8",
    "IL6",
    "KLF4",
    "MIDN",
    "NCOA7",
    "OXNAD1",
    "PPP1R15A",
    "SBNO2",
    "SQSTM1",
    "TNFAIP6",
    "UBC",
    "ZYX"
]
StatsFunctions
def DEG_analysis(adata, groupby, query_subtype, reference_subtype, dw=True):
    ## stats
    sc.tl.rank_genes_groups(adata, groupby=groupby, method="t-test", key_added='rank_genes_test',
                            groups=[query_subtype], reference=reference_subtype)
    diff_exp_genes = pd.DataFrame(np.hstack([
        np.array(list(map(list, adata.uns["rank_genes_test"]["names"]))),
        np.array(list(map(list, adata.uns["rank_genes_test"]['logfoldchanges']))),
        np.array(list(map(list, adata.uns["rank_genes_test"]['pvals_adj'])))
    ]),
            columns = list(range(3))
    )

    diff_exp_genes_up = diff_exp_genes[(~diff_exp_genes[0].isin(blacklist)) &
                                        (diff_exp_genes[1].astype('float')>=0.25) & #1.5
                                        (diff_exp_genes[2].astype('float')<=0.05)] #0.01
    diff_exp_genes_dw = diff_exp_genes[(~diff_exp_genes[0].isin(blacklist)) &
                                        (diff_exp_genes[1].astype('float')<=-0.25) &
                                        (diff_exp_genes[2].astype('float')<=0.05)]
    def enr_res(adata=adata,
                groupby=groupby,
                diff_exp_genes=diff_exp_genes_up,
                subtype=query_subtype):
        ht = sc.pl.dotplot(
            adata,
            diff_exp_genes.iloc[:,0],
            groupby=groupby,
            show=False,
            return_fig=True
        )
        size_df = ht.dot_size_df

        s = set(size_df.loc[subtype,size_df.loc[subtype] > 0.25].index)
        enr_res_df = pd.DataFrame(list(filter(lambda x: x in s, diff_exp_genes.iloc[:,0])))
        enr_res_use = gseapy.enrichr(gene_list=enr_res_df.iloc[:,0],
                            organism='Human',
                            gene_sets=['GO_Biological_Process_2021'])
        return enr_res_use
    enr_res_up = enr_res(diff_exp_genes=diff_exp_genes_up, subtype=query_subtype)
    if dw==True:
        enr_res_dw = enr_res(diff_exp_genes=diff_exp_genes_dw, subtype=reference_subtype)
    else:
        enr_res_dw = enr_res_up

    return diff_exp_genes,diff_exp_genes_up,diff_exp_genes_dw,enr_res_up,enr_res_dw
def condition_cell_ratio(adata0, source, cell_type1, cell_type2, cell_type3=None):
    adata0 = adata0[adata0.obs['meta_tissue_type_aggr']==source]
    a1 = pd.Series(Counter(adata0.obs[adata0.obs["cell_subtype_3"]==cell_type1].sample_name))
    b1 = pd.Series(Counter(adata0.obs.sample_name))
    x1 = pd.DataFrame({"ratio":a1/b1})
    x1 = x1.fillna(0)

    a2 = pd.Series(Counter(adata0.obs[adata0.obs["cell_subtype_3"]==cell_type2].sample_name))
    b2 = pd.Series(Counter(adata0.obs.sample_name))
    x2 = pd.DataFrame({"ratio":a2/b2})
    x2 = x2.fillna(0)
    x0 = pd.concat([x1,x2])

    x0['subtype'] = (
        list(np.repeat(cell_type1, len(x1))) +
        list(np.repeat(cell_type2, len(x2)))
    )

    if cell_type3 is not None:
        a3 = pd.Series(Counter(adata0.obs[adata0.obs["cell_subtype_3"]==cell_type3].sample_name))
        b3 = pd.Series(Counter(adata0.obs.sample_name))
        x3 = pd.DataFrame({"ratio":a3/b3})
        x3 = x3.fillna(0)
        x0 = pd.concat([x0,x3])

        x0['subtype'] = (
            list(np.repeat(cell_type1, len(x1))) +
            list(np.repeat(cell_type2, len(x2))) +
            list(np.repeat(cell_type3, len(x3)))
        )

    return x0
def tissue_pie_data(adata_use=adata_nogex,
                    groupby='disease_type', groupby_type='Healthy',
                    ratioby='cell_subtype_3',
                    ratioby_type=['ITGAE+ Trm', 'ITGB2+ Trm', 'GZMK+ Tex', 'CXCR6+ Tex'],
                    expanded=True):

    adata = adata_use[adata_use.obs[groupby]==groupby_type]

    if expanded == 'large':
        adata_use = adata[
            (adata.obs['expansion_level'].str.contains('100')) |
            (adata.obs['expansion_level'].str.contains('50'))
        ]
    elif expanded == True:
        adata_use = adata[
            adata.obs['cc_aa_identity_size']>=3
        ]
    else:
        adata_use = adata

    pie_list = []
    for i in ratioby_type:
        TNum = pd.Series(Counter(adata_use.obs[ratioby])).loc[i]
        pie_list.append(TNum)

    OtherNum = len(adata_use.obs)-sum(pie_list)
    pie_list.append(OtherNum)

    ratio = len(adata_use.obs)/len(adata.obs)
    return pie_list, ratio
PlotsFunctions
def ScanpyVolcanoPlot(
    adata,
    axis,
    use_adjusted_p = True,
    show_label=True,
    label_fold_change = 2,
    label_log_p = 80,
    label_includes=[],
    label_excludes=[],
    add_grid=True,
    label_size=4,
    color1 = '#F09D30',
    color2='#3D5FA6',
    max_abs_fc=5,
    dot_size=12,
    size_by=None,
    size_group=None,
    size_reference=None
):
    fig,ax = createFig()
    log2foldchanges = list(map(lambda x: x[axis], adata.uns['rank_genes_groups']['logfoldchanges']))
    if use_adjusted_p:
        log10adjp = -np.log10(list(map(lambda x: x[axis], adata.uns['rank_genes_groups']['pvals_adj'])))
    else:
        log10adjp = -np.log10(list(map(lambda x: x[axis], adata.uns['rank_genes_groups']['pvals'])))
    log10adjp[log10adjp==np.inf] = 320
    gene_names = list(map(lambda x: x[axis], adata.uns['rank_genes_groups']['names']))
    indices = list(map(lambda x: abs(x) < max_abs_fc, log2foldchanges))

    size_frac = {}
    if size_by is not None and size_group is not None:
        _adata = adata[
            adata.obs[size_by] == size_group
        ]
        frac = (_adata[:,gene_names].X > 0).sum(0) / _adata.shape[0]
        frac = np.array(frac).flatten()
        if size_reference is not None:
            _adata = adata[
                adata.obs[size_by] == size_reference
            ]
            frac_other = (_adata[:,gene_names].X > 0).sum(0) / _adata.shape[0]
            frac_other = np.array(frac_other).flatten()
        else:
            _adata = adata[
                adata.obs[size_by] != size_group
            ]
            frac_other = (_adata[:,gene_names].X > 0).sum(0) / _adata.shape[0]
            frac_other = np.array(frac_other).flatten()

    for i in label_includes:
        print(f"Fraction of gene {i} is {frac[gene_names.index(i)]}")

    ax.scatter(
        x = np.array(log2foldchanges)[indices],
        y = np.array(log10adjp[indices]),
        s = dot_size if size_by is None else [frac[indices][x[0]] * dot_size \
            if x[1] > 0 \
            else frac_other[indices][x[0]] * dot_size \
            for x in enumerate(np.array(log2foldchanges)[indices])],
        alpha=0.8,
        linewidth = 0,
        c = list(map(lambda x: color1 if abs(x[0]) > label_fold_change and x[1] > label_log_p and x[0] < 0 \
                 else color2 if abs(x[0]) > label_fold_change and x[1] > label_log_p and x[0] > 0 \
                 else 'gray',  np.array(list(zip(log2foldchanges, log10adjp)))[indices]))
    )
    if add_grid:
        ax.axvline(-label_fold_change, color ="black", alpha = 0.8, lw = 0.8, ls='--')
        ax.axvline(label_fold_change, color ="black", alpha = 0.8, lw = 0.8, ls='--')
        ax.axhline(label_log_p, color ="black", alpha = 0.8, lw = 0.8, ls='--')
        ax.grid(alpha=0.4)
    if show_label:
        indices = list(map(lambda x: abs(x[0]) > label_fold_change and x[1] > label_log_p and abs(x[0]) < max_abs_fc, zip(log2foldchanges, log10adjp)))
        all_text = []
        for i,j,s in zip(np.array(log2foldchanges)[indices],np.array(log10adjp)[indices],
             list(map(lambda x: x[axis], adata.uns['rank_genes_groups']['names'][indices]))):
             if label_excludes is not None and label_excludes != [] and s in label_excludes:
                 if label_includes is not None and label_includes != [] and s in label_includes:
                     all_text.append(ax.annotate(
                        xy=(i,j),
                        text=s,
                        size=8,
                        xytext=(-5,5) if i < 0 else (5,5),
                        textcoords='offset points',
                        ha='center',
                        #va="baseline",
                        arrowprops=dict(
                            arrowstyle='-',
                            mutation_scale=0.005,
                            color='black',
                            lw=0.5,
                            ls='-',
                        )
                    ))
                 else:
                     continue
    from adjustText import adjust_text
    adjust_text(all_text, ax=ax)

    ax.set_xlabel("Log2(FoldChanges)")
    ax.set_ylabel("-Log10(FDR)")
    return fig,ax
def volcanoPlot(diff_exp_genes, file_name=str):
    result = pd.DataFrame()
    diff_exp_genes[1] = diff_exp_genes[1].astype('float')
    result['x'] = diff_exp_genes[1]
    diff_exp_genes[2] = diff_exp_genes[2].astype('float')
    result['y'] = [-np.log10(x) for x in diff_exp_genes[2]]
    result.replace([np.inf, -np.inf], 320, inplace=True)


    #set threshold
    x_threshold=1
    y_threshold=2

    #groupby up, normal, down
    result['group'] = 'black'
    result.loc[(result.x > x_threshold)&(result.y > y_threshold),'group'] = 'tab:red' #x=-+x_threshold直接截断
    result.loc[(result.x < -x_threshold)&(result.y > y_threshold),'group'] = 'tab:blue' #x=-+x_threshold直接截断
    result.loc[result.y < y_threshold,'group'] = 'dimgrey' #阈值以下点为灰色
    print(result.head())

    ## xtick limit
    xmin=-10
    xmax=10
    ymin=-20
    ymax=340

    ## scatter
    fig = plt.figure(figsize=(7,7)) #确定fig比例(h/w)
    ax = fig.add_subplot()
    ax.set(xlim=(xmin, xmax), ylim=(ymin, ymax), title='')
    ax.scatter(result['x'], result['y'], s=6, c=result['group'])
    ## ax.set_ylabel('-Log10(Q value)',fontweight='bold')
    ## ax.set_xlabel('Log2 (fold change)',fontweight='bold')
    ax.spines['right'].set_visible(False) #去掉右边框
    ax.spines['top'].set_visible(False) #去掉上边框

    ## horizontal and vertical line
    ax.vlines(-x_threshold, ymin, ymax, color='dimgrey',linestyle='dashed', linewidth=1) #画竖直线
    ax.vlines(x_threshold, ymin, ymax, color='dimgrey',linestyle='dashed', linewidth=1) #画竖直线
    ax.hlines(y_threshold, xmin, xmax, color='dimgrey',linestyle='dashed', linewidth=1) #画竖水平线

    ax.set_xticks(range(xmin,xmax,2))#设置x轴刻度起点和步长
    ## ax.set_xticklabels(labels=ax.get_xticklabels(),rotation=45)
    ax.set_yticks(range(ymin,ymax,40)) #设置y轴刻度起点和步长

    fig.savefig(file_name, dpi=600)
    plt.show()
## stats of clonotype sharing
def circos_edges(clone_df, subtypes, file_name, specific_subtype=None,
                 first_index='first', second_index='second'):

    edges = pd.DataFrame([], columns=['source', 'target', 'value'])

    if specific_subtype is not None:
        for i in subtypes:
            clonei_qualified = clone_df[(clone_df[first_index]==specific_subtype) |
                                        (clone_df[second_index]==specific_subtype)]
            clonej_qualified = clonei_qualified[(clonei_qualified[first_index]==i) |
                                                (clonei_qualified[second_index]==i)]
            rows = [specific_subtype, i, len(clonej_qualified)]
            edges.loc[len(edges.index)] = rows
    else:
        for idx, i in enumerate(subtypes):
            if idx < len(subtypes)-1:
                for j in subtypes[idx+1:]:
                    clonei_qualified = clone_df[(clone_df[first_index]==i) | (clone_df[second_index]==i)]
                    clonej_qualified = clonei_qualified[(clonei_qualified[first_index]==j) |
                                                        (clonei_qualified[second_index]==j)]
                    rows = [i, j, len(clonej_qualified)]
                    edges.loc[len(edges.index)] = rows
            else: pass

    edges = edges[edges.ne(0).all(axis=1)]
    edges.to_csv(file_name, header=True, index=False)
    return edges
## Figure2D, stats of circos plot
def sanke_plot(circos_df, column1, column2, file_name):
    circos_df['sg'] = None
    circos_df.loc[circos_df['source']==column1,'sg'] = 0
    circos_df.loc[circos_df['source']==column2,'sg'] = 2
    circos_df.loc[circos_df['sg'].isna(),'sg'] = 1

    circos_df['tg'] = None
    circos_df.loc[circos_df['target']==column1,'tg'] = 0
    circos_df.loc[circos_df['target']==column2,'tg'] = 2
    circos_df.loc[circos_df['tg'].isna(),'tg'] = 1

    circos_df = circos_df[(circos_df['sg']!=1) | (circos_df['tg']!=1)]
    try:
        inter_value = circos_df[(circos_df['sg']==0) & (circos_df['tg']==2)].value[0]
    except:
        inter_value = 0

    circos_df = circos_df[(circos_df['sg']!=0) | (circos_df['tg']!=2)]

    col1_num = sum(circos_df[(circos_df['source']==column1) |
                             (circos_df['target']==column1)].value)
    col2_num = sum(circos_df[(circos_df['source']==column2) |
                             (circos_df['target']==column2)].value)
    circos_df['value_raw'] = circos_df['value']
    circos_df.loc[(circos_df['sg']==0) | (circos_df['tg']==0),
                      'value'] = (circos_df.loc[(circos_df['sg']==0) | (circos_df['tg']==0),
                                                   'value']/col1_num)*100
    circos_df.loc[(circos_df['sg']==2) | (circos_df['tg']==2),
                      'value'] = (circos_df.loc[(circos_df['sg']==2) | (circos_df['tg']==2),
                                                   'value']/col2_num)*100
    circos_df.to_csv(file_name)

    venn_df = [col1_num, col2_num, inter_value]

    return circos_df,venn_df
## Figure2D, stats of circos plot
def sanke_plot3(circos_df, column1, column2, column3, file_name):
    circos_df['sg'] = None
    circos_df.loc[circos_df['source'].isin([column1,column2,column3]),'sg'] = 0
    circos_df.loc[circos_df['sg'].isna(),'sg'] = 1

    circos_df['tg'] = None
    circos_df.loc[circos_df['target'].isin([column1,column2,column3]),'tg'] = 0
    circos_df.loc[circos_df['tg'].isna(),'tg'] = 1

    circos_df = circos_df[(circos_df['sg']==0)|(circos_df['tg']==0)]

    inter_value12 = int(circos_df[(circos_df['source']==column1) &
                              (circos_df['target']==column2)].value)
    inter_value13 = int(circos_df[(circos_df['source']==column1) &
                              (circos_df['target']==column3)].value)
    inter_value23 = int(circos_df[(circos_df['source']==column2) &
                              (circos_df['target']==column3)].value)

    circos_df = circos_df[circos_df['tg']!=0]

    col1_num = sum(circos_df[circos_df['source']==column1].value)
    col2_num = sum(circos_df[circos_df['source']==column2].value)
    col3_num = sum(circos_df[circos_df['source']==column3].value)

    circos_df['value_raw'] = circos_df['value']

    circos_df.loc[circos_df['source']==column1, 'value'] = (
        circos_df.loc[circos_df['source']==column1, 'value']/col1_num
    )*100
    circos_df.loc[circos_df['source']==column2, 'value'] = (
        circos_df.loc[circos_df['source']==column2, 'value']/col1_num
    )*100
    circos_df.loc[circos_df['source']==column3, 'value'] = (
        circos_df.loc[circos_df['source']==column3, 'value']/col1_num
    )*100
    circos_df.to_csv(file_name)

    venn_df = [col1_num, col2_num, inter_value12, col3_num, inter_value13, inter_value23, 0]

    return circos_df,venn_df
from matplotlib.patches import PathPatch

def adjust_box_widths(g, fac):
    """
    Adjust the withs of a seaborn-generated boxplot.
    """

    # iterating through Axes instances
    for ax in g.axes:

        # iterating through axes artists:
        for c in ax.get_children():

            # searching for PathPatches
            if isinstance(c, PathPatch):
                # getting current width of box:
                p = c.get_path()
                verts = p.vertices
                verts_sub = verts[:-1]
                xmin = np.min(verts_sub[:, 0])
                xmax = np.max(verts_sub[:, 0])
                xmid = 0.5*(xmin+xmax)
                xhalf = 0.5*(xmax - xmin)

                # setting new width of box
                xmin_new = xmid-fac*xhalf
                xmax_new = xmid+fac*xhalf
                verts_sub[verts_sub[:, 0] == xmin, 0] = xmin_new
                verts_sub[verts_sub[:, 0] == xmax, 0] = xmax_new

                # setting new width of median line
                for l in ax.lines:
                    if np.all(l.get_xdata() == [xmin, xmax]):
                        l.set_xdata([xmin_new, xmax_new])
adata_ex = adata_nogex[adata_nogex.obs['cell_subtype_3'].str.contains('Tex')]
adata_gene.uns['log1p']['base'] = None
adata_ex_allg = adata_gene[adata_gene.obs['cell_subtype_3'].str.contains('Tex')]
MainFigure2
DEG Analysis
rt_path = '/Users/snow/Desktop/2023-NM-Revision-GEX-HuARdb-Notebooks/data/'
adata_tex = sc.read_h5ad(rt_path+'20231210Tex.retrain_vae.h5ad')
adata_tex_allg = adata_gene[adata_tex.obs.index]
## import matplotlib.patches as mpatch
from adjustText import adjust_text
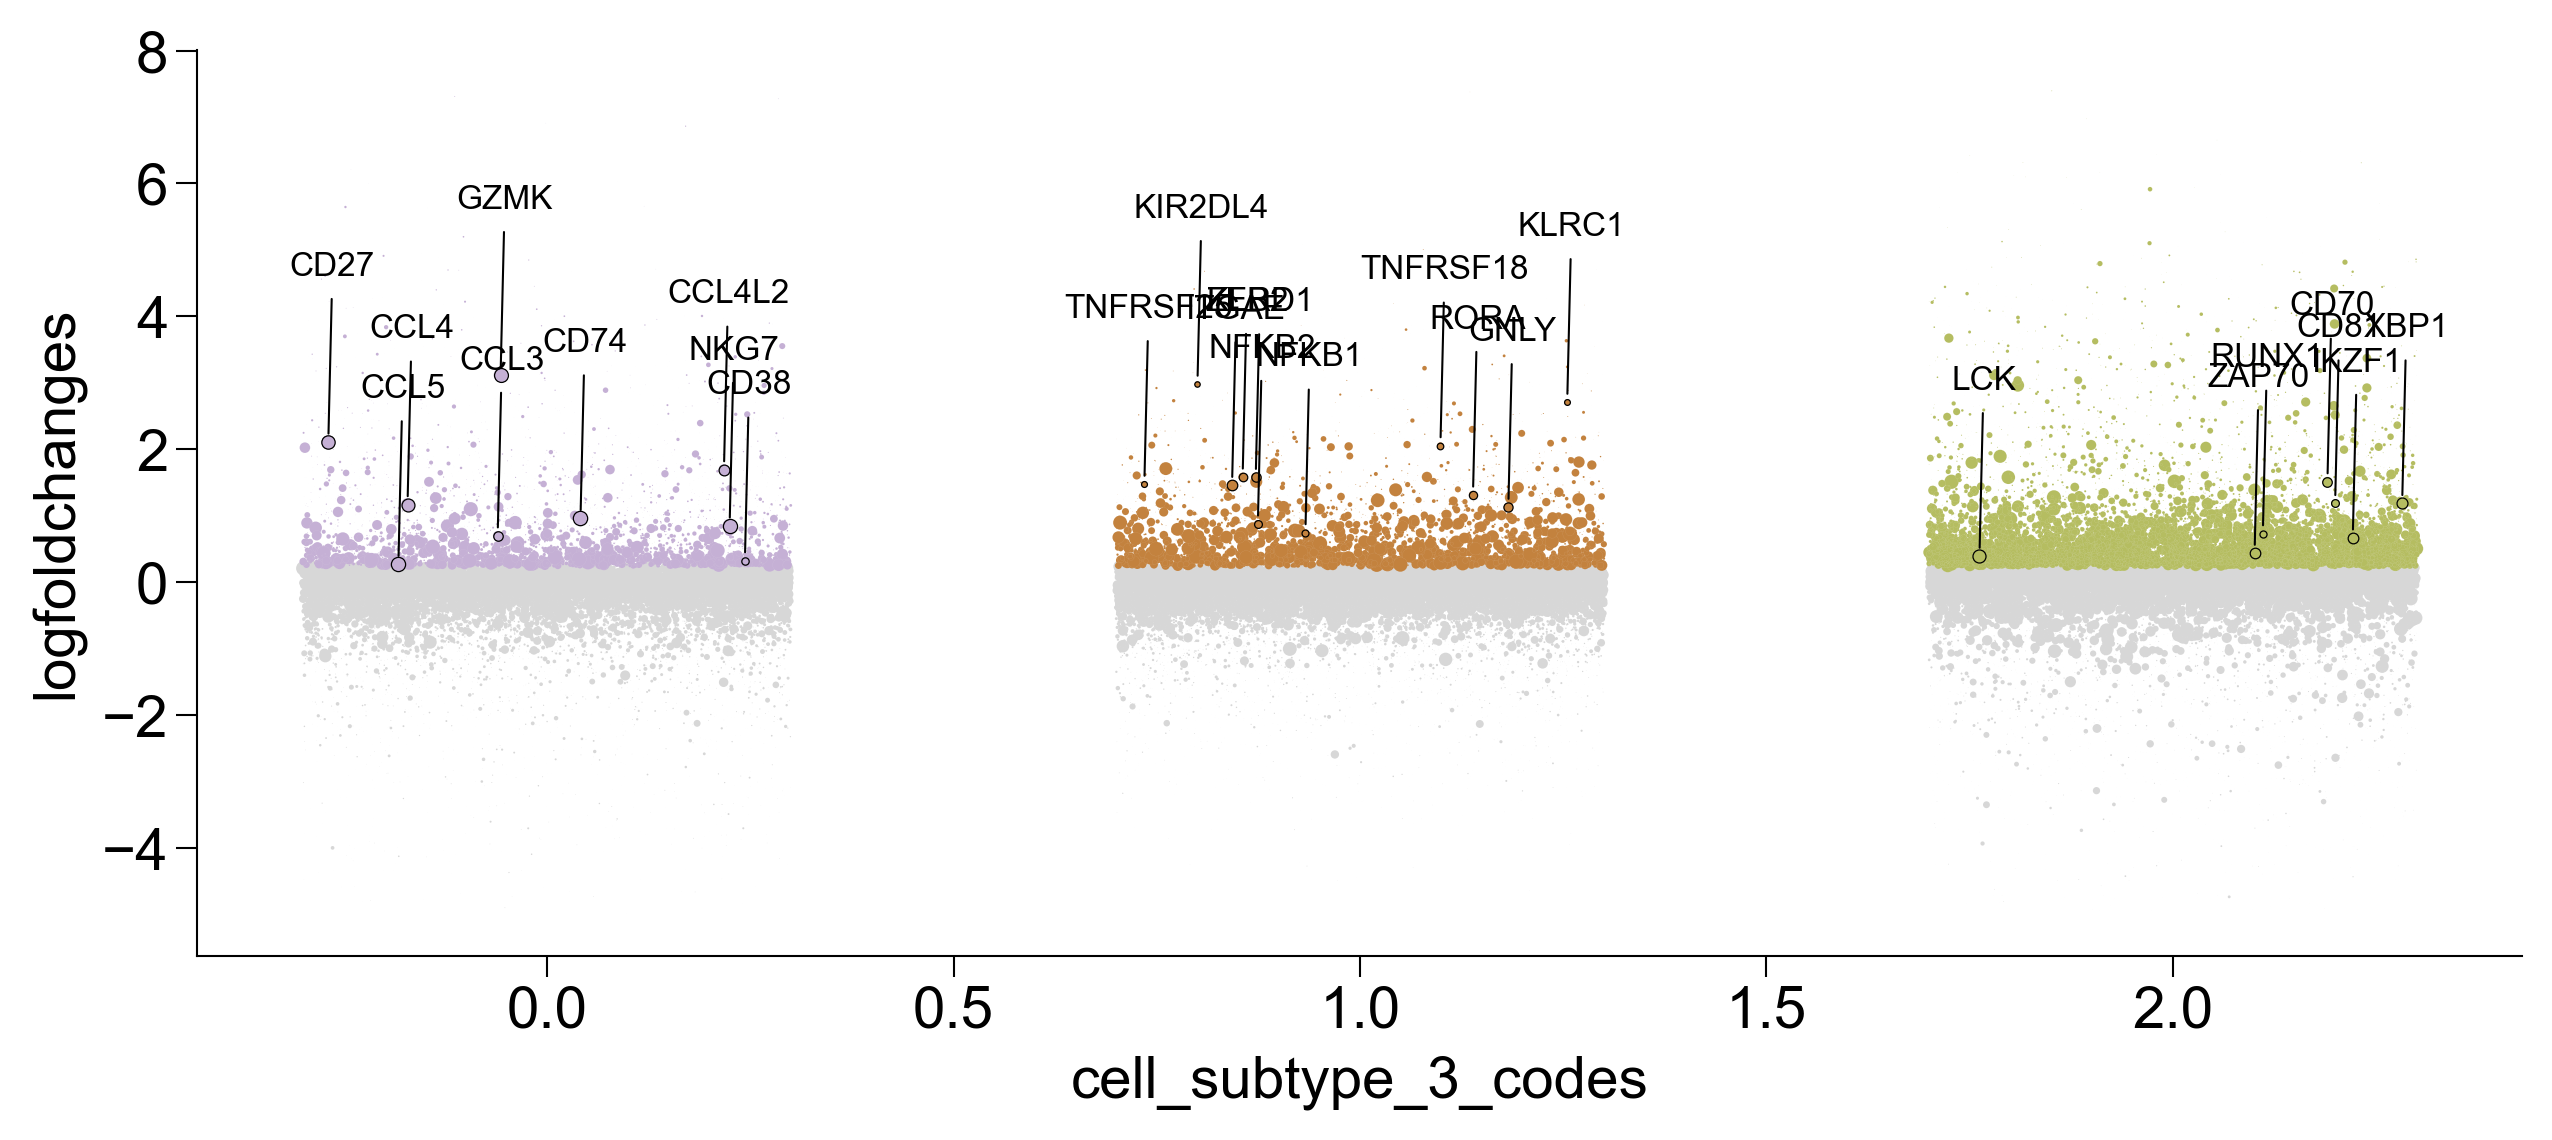
adata = adata_ex_allg
palette=subtype_color
fig,ax=createFig(figsize=(10,4))
groupby='cell_subtype_3'
group_frac_dict = {}
for size_obs_group in np.unique(adata.obs[groupby]):
_adata = adata[
adata.obs[groupby] == size_obs_group
]
frac = dict(zip(_adata.var.index, np.array((_adata.X > 0).sum(0) / _adata.shape[0]).flatten()))
group_frac_dict[size_obs_group] = frac
result = []
columns = list(pd.DataFrame(adata.uns['rank_genes_groups']['logfoldchanges']).columns)
for i,j,k in zip(pd.DataFrame(adata.uns['rank_genes_groups']['logfoldchanges']).to_numpy(),
pd.DataFrame(adata.uns['rank_genes_groups']['names']).to_numpy(),
pd.DataFrame(adata.uns['rank_genes_groups']['pvals_adj']).to_numpy(),
):
for e,(m,n,p) in enumerate(zip(i,j,-np.log10(k))):
result.append((columns[e],m,n,p))
result = pd.DataFrame(result, columns=[groupby,'logfoldchanges','gene_name','pvals_adj'])
result = result.sort_values(groupby)
result['size'] = list(map(lambda x: group_frac_dict[x[0]][x[1]], zip(result['cell_subtype_3'],result['gene_name'])))
result[groupby] = result[groupby].astype('category') # make sure the column uses pandas categorical type
# make a numerical column and add some jitter
result[groupby + '_codes'] = result[groupby].cat.codes + np.random.uniform(-0.3, 0.3, len(result))
_data = result[
np.array(result['logfoldchanges'] > 0) &
np.array(np.abs(result['logfoldchanges']) < 10) &
(np.array(np.abs(result['logfoldchanges']) < 0.25) |
np.array(np.abs(result['pvals_adj']) <= 2))
]
sns.scatterplot(
data=_data,
x=groupby + '_codes',
y = 'logfoldchanges',
ax=ax,
marker='o',
size='size',
sizes=(0,12),
color='#D7D7D7',
zorder=-1,
legend=False
)
_data = result[
np.array(result['logfoldchanges'] > 0) &
np.array(np.abs(result['logfoldchanges']) < 10) &
np.array(np.abs(result['logfoldchanges']) >= 0.25) &
np.array(np.abs(result['pvals_adj']) > 2)
]
for i in np.unique(_data[groupby]):
st = sns.scatterplot(
data=_data[_data[groupby] == i],
x=groupby + '_codes',
y = 'logfoldchanges',
ax=ax,
marker='o',
size='size',
sizes=(0,12),
color=subtype_color[i],
zorder=-1,
legend=False
)
_data = result[
np.array(result['logfoldchanges'] < 0) &
np.array(np.abs(result['logfoldchanges']) < 5) &
(np.array(np.abs(result['logfoldchanges']) < 0.25) |
np.array(np.abs(result['pvals_adj']) <= 2))
]
sns.scatterplot(
data=_data,
x=groupby + '_codes',
y = 'logfoldchanges',
ax=ax,
marker='o',
size='size',
sizes=(0,12),
color='#D7D7D7',
zorder=-1,
legend=False
)
_data = result[
np.array(result['logfoldchanges'] < 0) &
np.array(np.abs(result['logfoldchanges']) < 5) &
np.array(np.abs(result['logfoldchanges']) > 0.25) &
np.array(np.abs(result['pvals_adj']) > 2)
]
sns.scatterplot(
data=_data,
x=groupby + '_codes',
y = 'logfoldchanges',
ax=ax,
marker='o',
size='size',
sizes=(0,12),
color='#D7D7D7',
zorder=-1,
legend=False
)
all_collections = list(filter(lambda x:
isinstance(x, matplotlib.collections.PathCollection),
st.get_children()
))
mdict = {}
all_text = []
for e,(i,j,k,q )in enumerate(zip(pd.DataFrame(adata.uns['rank_genes_groups']['logfoldchanges']).to_numpy().T,
pd.DataFrame(adata.uns['rank_genes_groups']['names']).to_numpy().T,
pd.DataFrame(adata.uns['rank_genes_groups']['pvals_adj']).to_numpy().T,
[
[
'CD27',
'CD74',
'CD38',
'CCL3',
'CCL4',
'CCL4L2',
'CCL5',
'GZMK',
'NKG7',
],[
'ITGAE',
'KLRD1',
'KLRC1',
'KIR2DL4',
'TNFRSF18',
'TNFRSF25',
'GNLY',
'ZEB2',
'NFKB1',
'NFKB2',
'RORA'
],[
'CD81',
'CD70',
'LCK',
'ZAP70',
'XBP1',
'IKZF1',
'RUNX1',
]
])):
for _,(m,n,p) in enumerate(zip(i,j,k)):
if n in q:
x,y=result.loc[
np.array(result[groupby].cat.codes == e) &
np.array(result['gene_name'] == n),
groupby + '_codes'
].iloc[0],m
ax.scatter(x,y,lw=.3, edgecolor='black',c=subtype_color[[
'GZMK+ Tex', 'ITGAE+ Tex', 'S100A11+ Tex'
][e]], s=group_frac_dict[[
'GZMK+ Tex', 'ITGAE+ Tex', 'S100A11+ Tex'
][e]][n] * 12)
fig.savefig('./figures/2024023_triple_tex_deg.png', dpi=600)
for e,(i,j,k,q )in enumerate(zip(pd.DataFrame(adata.uns['rank_genes_groups']['logfoldchanges']).to_numpy().T,
pd.DataFrame(adata.uns['rank_genes_groups']['names']).to_numpy().T,
pd.DataFrame(adata.uns['rank_genes_groups']['pvals_adj']).to_numpy().T,
[
[
'CD27',
'CD74',
'CD38',
'CCL3',
'CCL4',
'CCL4L2',
'CCL5',
'GZMK',
'NKG7',
],[
'ITGAE',
'KLRD1',
'KLRC1',
'KIR2DL4',
'TNFRSF18',
'TNFRSF25',
'GNLY',
'ZEB2',
'NFKB1',
'NFKB2',
'RORA'
],[
'CD81',
'CD70',
'LCK',
'ZAP70',
'XBP1',
'IKZF1',
'RUNX1',
]
])):
for _,(m,n,p) in enumerate(zip(i,j,k)):
if n in q:
x,y=result.loc[
np.array(result[groupby].cat.codes == e) &
np.array(result['gene_name'] == n),
groupby + '_codes'
].iloc[0],m
all_text.append(
ax.annotate(
xy=(x,y),
text=n,
size=8,
xytext=(1,40),
textcoords='offset points',
ha='center',
#va="baseline",
arrowprops=dict(
arrowstyle='-',
mutation_scale=0.005,
color='black',
lw=0.5,
ls='-',
)
)
)
# adjust_text(all_text,ax=ax)
plt.show()
fig.savefig('figures/2024023_triple_tex_deg.pdf')
/var/folders/lw/6xch0fpj02j61gwkgwfbv2940000gn/T/ipykernel_43451/1168359865.py:15: RuntimeWarning: divide by zero encountered in log10
  for e,(m,n,p) in enumerate(zip(i,j,-np.log10(k))):
GO Term Analysis
## deg_tex,deg_tex_up,deg_tex_dw,enr_tex_up,enr_tex_dw
gzmk_ls = DEG_analysis(adata_ex_allg, groupby='cell_subtype_3',
                       query_subtype='GZMK+ Tex', reference_subtype='rest', dw=False)
## deg_tex,deg_tex_up,deg_tex_dw,enr_tex_up,enr_tex_dw
itgae_ls = DEG_analysis(adata_ex_allg, groupby='cell_subtype_3',
                       query_subtype='ITGAE+ Tex', reference_subtype='rest', dw=False)
## deg_tex,deg_tex_up,deg_tex_dw,enr_tex_up,enr_tex_dw
xbp_ls = DEG_analysis(adata_ex_allg, groupby='cell_subtype_3',
                       query_subtype='XBP1+ Tex', reference_subtype='rest', dw=False)
gzmk_go = gzmk_ls[3].res2d[gzmk_ls[3].res2d['Adjusted P-value']<0.05]
itgae_go = itgae_ls[3].res2d[itgae_ls[3].res2d['Adjusted P-value']<0.05]
xbp_go = xbp_ls[3].res2d[xbp_ls[3].res2d['Adjusted P-value']<0.05]
gzmk_go_inter = gzmk_go.append([itgae_go,xbp_go])
gzmk_go_inter = gzmk_go_inter.drop_duplicates(['Term'], keep=False)
gzmk_go_inter[0:50]
| Gene_set | Term | Overlap | P-value | Adjusted P-value | Old P-value | Old Adjusted P-value | Odds Ratio | Combined Score | Genes | |
|---|---|---|---|---|---|---|---|---|---|---|
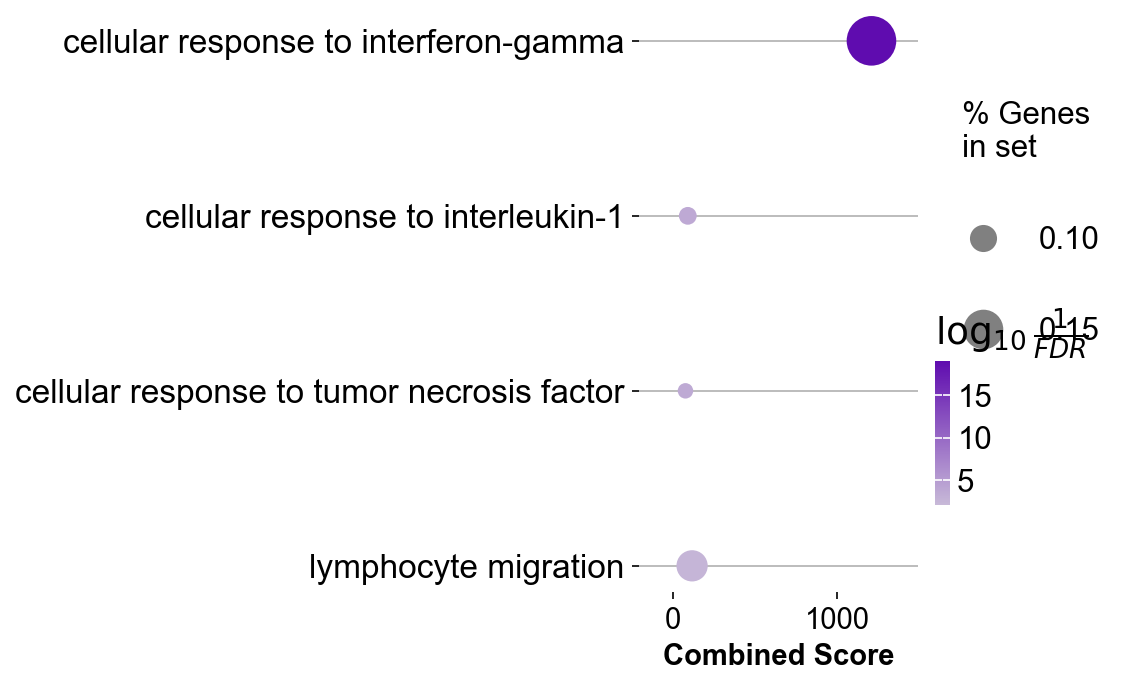
| 0 | GO_Biological_Process_2021 | cellular response to interferon-gamma (GO:0071... | 24/121 | 4.791630e-23 | 9.257430e-20 | 0 | 0 | 23.513522 | 1208.420691 | HLA-DRB5;VCAM1;CCL3L1;STAT1;HLA-C;HLA-A;HLA-F;... |
| 1 | GO_Biological_Process_2021 | interferon-gamma-mediated signaling pathway (G... | 18/68 | 5.232690e-20 | 5.054779e-17 | 0 | 0 | 33.327887 | 1479.650758 | HLA-DRB5;VCAM1;STAT1;HLA-C;HLA-A;HLA-F;OASL;HL... |
| 11 | GO_Biological_Process_2021 | antigen processing and presentation of exogeno... | 9/73 | 1.599254e-07 | 2.574799e-05 | 0 | 0 | 12.482052 | 195.326127 | PSMB3;PSME1;HLA-C;PSME2;HLA-A;HLA-F;PSMB10;HLA... |
| 12 | GO_Biological_Process_2021 | antigen processing and presentation of exogeno... | 9/78 | 2.857599e-07 | 4.246831e-05 | 0 | 0 | 11.574618 | 174.407666 | PSMB3;PSME1;HLA-C;PSME2;HLA-A;HLA-F;PSMB10;HLA... |
| 14 | GO_Biological_Process_2021 | antigen processing and presentation of endogen... | 5/14 | 3.619638e-07 | 4.662094e-05 | 0 | 0 | 48.574238 | 720.439570 | HLA-DRA;HLA-A;HLA-F;HLA-DRB1;HLA-E |
| 15 | GO_Biological_Process_2021 | antigen processing and presentation of endogen... | 4/7 | 5.905587e-07 | 6.711526e-05 | 0 | 0 | 116.099853 | 1665.126939 | HLA-C;HLA-A;HLA-F;HLA-E |
| 16 | GO_Biological_Process_2021 | antigen processing and presentation of endogen... | 4/7 | 5.905587e-07 | 6.711526e-05 | 0 | 0 | 116.099853 | 1665.126939 | HLA-C;HLA-A;HLA-F;HLA-E |
| 17 | GO_Biological_Process_2021 | antigen processing and presentation of exogeno... | 4/8 | 1.170412e-06 | 1.256242e-04 | 0 | 0 | 87.070485 | 1189.222132 | HLA-C;HLA-A;HLA-F;HLA-E |
| 18 | GO_Biological_Process_2021 | cellular response to interleukin-1 (GO:0071347) | 11/155 | 1.934576e-06 | 1.967158e-04 | 0 | 0 | 6.814236 | 89.645517 | CCL3L1;UBB;PSMB3;CCL5;CCL4;PSME1;CCL3;PSME2;RB... |
| 21 | GO_Biological_Process_2021 | cellular response to tumor necrosis factor (GO... | 12/194 | 2.797056e-06 | 2.456323e-04 | 0 | 0 | 5.897034 | 75.405045 | CCL3L1;PSMB3;STAT1;TNFRSF9;CCL5;CCL4;PSME1;CCL... |
| 23 | GO_Biological_Process_2021 | positive regulation of leukocyte mediated cyto... | 6/43 | 9.487500e-06 | 7.637438e-04 | 0 | 0 | 14.221261 | 164.476500 | CRTAM;HLA-DRA;HLA-A;HLA-F;HLA-DRB1;HLA-E |
| 24 | GO_Biological_Process_2021 | positive regulation of T cell mediated cytotox... | 5/26 | 1.062088e-05 | 8.207812e-04 | 0 | 0 | 20.804888 | 238.271919 | HLA-DRA;HLA-A;HLA-F;HLA-DRB1;HLA-E |
| 25 | GO_Biological_Process_2021 | negative regulation by host of viral transcrip... | 4/13 | 1.142322e-05 | 8.488327e-04 | 0 | 0 | 38.688204 | 440.266452 | HDAC1;CCL5;CCL4;CCL3 |
| 27 | GO_Biological_Process_2021 | positive regulation of CD4-positive, CD25-posi... | 3/5 | 1.495090e-05 | 9.960390e-04 | 0 | 0 | 130.046053 | 1444.907793 | IFNG;HLA-DRA;HLA-DRB1 |
| 28 | GO_Biological_Process_2021 | positive regulation of natural killer cell che... | 3/5 | 1.495090e-05 | 9.960390e-04 | 0 | 0 | 130.046053 | 1444.907793 | CCL5;CCL4;CCL3 |
| 30 | GO_Biological_Process_2021 | regulation of T cell mediated cytotoxicity (GO... | 5/29 | 1.864039e-05 | 1.161717e-03 | 0 | 0 | 18.201512 | 198.217741 | HLA-DRA;HLA-A;HLA-F;HLA-DRB1;HLA-E |
| 32 | GO_Biological_Process_2021 | regulation of lymphocyte activation (GO:0051249) | 4/15 | 2.141506e-05 | 1.216880e-03 | 0 | 0 | 31.650781 | 340.290711 | SIT1;CCL5;CRTAM;IKZF3 |
| 33 | GO_Biological_Process_2021 | negative regulation of single stranded viral R... | 4/15 | 2.141506e-05 | 1.216880e-03 | 0 | 0 | 31.650781 | 340.290711 | APOBEC3C;APOBEC3G;MPHOSPH8;RESF1 |
| 36 | GO_Biological_Process_2021 | T cell mediated immunity (GO:0002456) | 4/16 | 2.829516e-05 | 1.448035e-03 | 0 | 0 | 29.011747 | 303.834800 | CD8A;CRTAM;BTN3A2;HLA-A |
| 37 | GO_Biological_Process_2021 | peptide antigen assembly with MHC protein comp... | 3/6 | 2.964657e-05 | 1.448035e-03 | 0 | 0 | 86.692982 | 903.875260 | HLA-DMA;HLA-DRA;HLA-DRB1 |
| 38 | GO_Biological_Process_2021 | positive regulation of cell-cell adhesion medi... | 3/6 | 2.964657e-05 | 1.448035e-03 | 0 | 0 | 86.692982 | 903.875260 | CCL5;CD3E;CXCL13 |
| 39 | GO_Biological_Process_2021 | neutrophil migration (GO:1990266) | 7/77 | 3.030208e-05 | 1.448035e-03 | 0 | 0 | 8.794196 | 91.497406 | CCL3L1;CCL5;ITGB2;CCL4;PECAM1;CCL3;CXCL13 |
| 40 | GO_Biological_Process_2021 | modulation by host of symbiont process (GO:005... | 5/32 | 3.072953e-05 | 1.448035e-03 | 0 | 0 | 16.176663 | 168.080169 | HDAC1;CCL5;CCL4;CCL3;NUCKS1 |
| 41 | GO_Biological_Process_2021 | antigen processing and presentation of peptide... | 5/33 | 3.587804e-05 | 1.650390e-03 | 0 | 0 | 15.598135 | 159.652921 | BCAP31;HLA-C;HLA-A;HLA-F;HLA-E |
| 42 | GO_Biological_Process_2021 | regulation of single stranded viral RNA replic... | 4/18 | 4.671692e-05 | 2.051298e-03 | 0 | 0 | 24.864695 | 247.935919 | APOBEC3C;APOBEC3G;MPHOSPH8;RESF1 |
| 43 | GO_Biological_Process_2021 | positive regulation of lymphocyte chemotaxis (... | 4/18 | 4.671692e-05 | 2.051298e-03 | 0 | 0 | 24.864695 | 247.935919 | CCL5;CCL4;CCL3;CXCL13 |
| 44 | GO_Biological_Process_2021 | regulation of natural killer cell chemotaxis (... | 3/7 | 5.143883e-05 | 2.208440e-03 | 0 | 0 | 65.016447 | 642.045042 | CCL5;CCL4;CCL3 |
| 45 | GO_Biological_Process_2021 | anaphase-promoting complex-dependent catabolic... | 7/84 | 5.330332e-05 | 2.238740e-03 | 0 | 0 | 7.991883 | 78.636229 | ANAPC16;UBB;PSMB3;PSME1;PSME2;PSMB10;PSMB9 |
| 46 | GO_Biological_Process_2021 | positive regulation of T cell mediated immunit... | 5/36 | 5.540566e-05 | 2.277526e-03 | 0 | 0 | 14.086497 | 138.059348 | HLA-DRA;HLA-A;HLA-F;HLA-DRB1;HLA-E |
| 47 | GO_Biological_Process_2021 | tumor necrosis factor-mediated signaling pathw... | 8/116 | 6.107338e-05 | 2.396148e-03 | 0 | 0 | 6.530809 | 63.371276 | PSMB3;STAT1;TNFRSF9;PSME1;PSME2;CD27;PSMB10;PSMB9 |
| 48 | GO_Biological_Process_2021 | regulation of interferon-gamma production (GO:... | 7/86 | 6.201212e-05 | 2.396148e-03 | 0 | 0 | 7.788766 | 75.458971 | CRTAM;HLA-DPB1;BTN3A2;HLA-A;HLA-DRB1;HAVCR2;HL... |
| 49 | GO_Biological_Process_2021 | regulation of neuron death (GO:1901214) | 7/86 | 6.201212e-05 | 2.396148e-03 | 0 | 0 | 7.788766 | 75.458971 | CD200R1;IFNG;UBB;CCL5;ITGB2;PARK7;HLA-F |
| 50 | GO_Biological_Process_2021 | positive regulation of alpha-beta T cell activ... | 4/20 | 7.263800e-05 | 2.751698e-03 | 0 | 0 | 21.754405 | 207.319970 | HLA-DRA;HLA-A;HLA-DRB1;HLA-E |
| 51 | GO_Biological_Process_2021 | regulation of cysteine-type endopeptidase acti... | 7/89 | 7.722786e-05 | 2.869312e-03 | 0 | 0 | 7.502668 | 71.040887 | BCAP31;ARL6IP1;F2R;CASP1;IFI6;PMAIP1;CYCS |
| 52 | GO_Biological_Process_2021 | lymphocyte migration (GO:0072676) | 5/40 | 9.314144e-05 | 3.395269e-03 | 0 | 0 | 12.474083 | 115.776851 | CCL3L1;CCL5;CCL4;CRTAM;CCL3 |
| 53 | GO_Biological_Process_2021 | pre-replicative complex assembly (GO:0036388) | 6/64 | 9.534653e-05 | 3.411287e-03 | 0 | 0 | 9.062529 | 83.900824 | UBB;PSMB3;PSME1;PSME2;PSMB10;PSMB9 |
| 55 | GO_Biological_Process_2021 | regulation of CD8-positive, alpha-beta T cell ... | 3/9 | 1.213568e-04 | 4.186810e-03 | 0 | 0 | 43.339912 | 390.786254 | CRTAM;HLA-A;HLA-E |
| 56 | GO_Biological_Process_2021 | lymphocyte chemotaxis (GO:0048247) | 5/44 | 1.480644e-04 | 4.979299e-03 | 0 | 0 | 11.192421 | 98.693238 | CCL3L1;CCL5;CCL4;CCL3;CXCL13 |
| 59 | GO_Biological_Process_2021 | neutrophil chemotaxis (GO:0030593) | 6/70 | 1.574189e-04 | 5.045310e-03 | 0 | 0 | 8.210417 | 71.895336 | CCL3L1;CCL5;ITGB2;CCL4;CCL3;CXCL13 |
| 62 | GO_Biological_Process_2021 | positive regulation of I-kappaB kinase/NF-kapp... | 9/171 | 1.725009e-04 | 5.290027e-03 | 0 | 0 | 4.906657 | 42.516711 | CD74;NDFIP1;F2R;CASP1;FASLG;RBCK1;CFLAR;TRIM22... |
| 63 | GO_Biological_Process_2021 | regulation of proteolysis involved in cellular... | 4/25 | 1.812497e-04 | 5.471476e-03 | 0 | 0 | 16.570589 | 142.766146 | ATP5IF1;UBB;PSME1;PSME2 |
| 64 | GO_Biological_Process_2021 | granulocyte chemotaxis (GO:0071621) | 6/73 | 1.985882e-04 | 5.902654e-03 | 0 | 0 | 7.841592 | 66.843902 | CCL3L1;CCL5;ITGB2;CCL4;CCL3;CXCL13 |
| 65 | GO_Biological_Process_2021 | regulation of cytokine-mediated signaling path... | 6/74 | 2.140505e-04 | 6.265843e-03 | 0 | 0 | 7.725882 | 65.278286 | CD74;IFNG;STAT1;PTPN6;RBCK1;CFLAR |
| 66 | GO_Biological_Process_2021 | regulation of transcription from RNA polymeras... | 6/75 | 2.304460e-04 | 6.645100e-03 | 0 | 0 | 7.613527 | 63.767046 | UBB;PSMB3;PSME1;PSME2;PSMB10;PSMB9 |
| 67 | GO_Biological_Process_2021 | positive regulation of cellular respiration (G... | 3/11 | 2.343354e-04 | 6.657882e-03 | 0 | 0 | 32.501645 | 271.673355 | IFNG;PARK7;ISCU |
| 68 | GO_Biological_Process_2021 | regulation of T cell proliferation (GO:0042129) | 6/76 | 2.478142e-04 | 6.938799e-03 | 0 | 0 | 7.504381 | 62.307608 | VCAM1;CCL5;HLA-DPB1;CD3E;HLA-DRB1;HLA-DPA1 |
| 70 | GO_Biological_Process_2021 | regulation of cellular amine metabolic process... | 5/51 | 2.999415e-04 | 8.087188e-03 | 0 | 0 | 9.485860 | 76.948566 | PSMB3;PSME1;PSME2;PSMB10;PSMB9 |
| 71 | GO_Biological_Process_2021 | regulation of mRNA stability (GO:0043488) | 8/146 | 3.013859e-04 | 8.087188e-03 | 0 | 0 | 5.103269 | 41.372810 | CARHSP1;UBB;PSMB3;CIRBP;PSME1;PSME2;PSMB10;PSMB9 |
| 72 | GO_Biological_Process_2021 | positive regulation of hydrolase activity (GO:... | 8/149 | 3.457169e-04 | 9.149657e-03 | 0 | 0 | 4.993926 | 39.801039 | CCL3L1;RGS1;CCL5;F2R;CCL4;CCL3;CALM3;MAPRE2 |
| 73 | GO_Biological_Process_2021 | regulation of cellular amino acid metabolic pr... | 5/54 | 3.926326e-04 | 1.025089e-02 | 0 | 0 | 8.903738 | 69.828782 | PSMB3;PSME1;PSME2;PSMB10;PSMB9 |
gzmk_ls[3].res2d.Term = gzmk_ls[3].res2d.Term.str.split(" \(GO").str[0]
## dotplot
gseapy.dotplot(gzmk_ls[3].res2d.iloc[[0,18,21,52],:], size=20,
        cmap=make_colormap(['#c8bad8', '#5f0caf']),
        figsize=(3,5), vmin=1.3)

plt.savefig('figures/gzmk_go_up.pdf')
plt.show()
itgae_go_inter = itgae_go.append([gzmk_go,xbp_go])
itgae_go_inter = itgae_go_inter.drop_duplicates(['Term'], keep=False)
itgae_go_inter[0:50]
| Gene_set | Term | Overlap | P-value | Adjusted P-value | Old P-value | Old Adjusted P-value | Odds Ratio | Combined Score | Genes | |
|---|---|---|---|---|---|---|---|---|---|---|
| 0 | GO_Biological_Process_2021 | cytoplasmic translation (GO:0002181) | 23/93 | 4.144822e-19 | 1.107496e-15 | 0 | 0 | 17.113752 | 724.378194 | EIF4A2;EIF4A1;RPL32;RPLP1;RPL22;RPL36A;GSPT1;R... |
| 1 | GO_Biological_Process_2021 | nuclear-transcribed mRNA catabolic process, no... | 24/113 | 3.216675e-18 | 4.297477e-15 | 0 | 0 | 14.069338 | 566.687397 | RPL32;RBM8A;RPLP1;EIF4A3;RPL22;RPL36A;GSPT1;RP... |
| 3 | GO_Biological_Process_2021 | nuclear-transcribed mRNA catabolic process (GO... | 25/171 | 6.698644e-15 | 4.474694e-12 | 0 | 0 | 8.931654 | 291.501234 | RPL32;RBM8A;RPLP1;EIF4A3;RPL36A;GSPT1;PPP2CA;R... |
| 4 | GO_Biological_Process_2021 | SRP-dependent cotranslational protein targetin... | 18/90 | 1.672122e-13 | 8.935821e-11 | 0 | 0 | 12.848684 | 378.002027 | RPL32;RPLP1;RPL22;RPL36A;RPS26;RPS17;RPS27;RPS... |
| 5 | GO_Biological_Process_2021 | cotranslational protein targeting to membrane ... | 18/94 | 3.695914e-13 | 1.645914e-10 | 0 | 0 | 12.169945 | 348.381437 | RPL32;RPLP1;RPL22;RPL36A;RPS26;RPS17;RPS27;RPS... |
| 8 | GO_Biological_Process_2021 | protein targeting to ER (GO:0045047) | 18/103 | 1.913071e-12 | 5.679696e-10 | 0 | 0 | 10.876347 | 293.468972 | RPL32;RPLP1;RPL22;RPL36A;RPS26;RPS17;RPS27;RPS... |
| 10 | GO_Biological_Process_2021 | cellular macromolecule biosynthetic process (G... | 27/314 | 2.019559e-10 | 4.905692e-08 | 0 | 0 | 4.897818 | 109.333860 | RPL32;MRPL18;RPLP1;RPL36A;GSPT1;RPS17;POLR2A;R... |
| 15 | GO_Biological_Process_2021 | mRNA processing (GO:0006397) | 22/300 | 1.700742e-07 | 2.840239e-05 | 0 | 0 | 4.067121 | 63.394338 | RBM17;RBM8A;CCNH;RNMT;BUD31;EIF4A3;SRRT;YBX1;H... |
| 19 | GO_Biological_Process_2021 | rRNA processing (GO:0006364) | 16/173 | 3.921314e-07 | 5.238876e-05 | 0 | 0 | 5.187581 | 76.525481 | RPL32;RIOK3;RPLP1;RPL22;RPL36A;RPS17;RPS27;RPL... |
| 23 | GO_Biological_Process_2021 | mRNA splicing, via spliceosome (GO:0000398) | 20/274 | 6.686261e-07 | 7.444037e-05 | 0 | 0 | 4.030330 | 57.303390 | RBM17;RBM8A;BUD31;EIF4A3;SRRT;YBX1;HNRNPL;PTBP... |
| 24 | GO_Biological_Process_2021 | RNA splicing, via transesterification reaction... | 19/251 | 7.355988e-07 | 7.862080e-05 | 0 | 0 | 4.185584 | 59.111244 | RBM17;RBM8A;BUD31;EIF4A3;SRRT;YBX1;HNRNPL;PTBP... |
| 25 | GO_Biological_Process_2021 | rRNA metabolic process (GO:0016072) | 15/162 | 8.919462e-07 | 9.166462e-05 | 0 | 0 | 5.183300 | 72.202650 | RPL32;RPLP1;RPL22;RPL36A;RPS17;RPS27;RPL37A;RP... |
| 27 | GO_Biological_Process_2021 | negative regulation of gene expression (GO:001... | 21/322 | 2.175059e-06 | 2.075628e-04 | 0 | 0 | 3.571834 | 46.571195 | PTGER4;SRGN;TGFB1;CITED2;EIF4A3;GZMB;PTPN22;MI... |
| 28 | GO_Biological_Process_2021 | ncRNA processing (GO:0034470) | 16/201 | 2.888248e-06 | 2.661172e-04 | 0 | 0 | 4.396095 | 56.071573 | RPL32;RPLP1;RPL22;SRRT;RPL36A;RPS17;RPS27;RPL3... |
| 30 | GO_Biological_Process_2021 | ribosome biogenesis (GO:0042254) | 15/192 | 7.395858e-06 | 6.374752e-04 | 0 | 0 | 4.298137 | 50.780728 | RPL32;RPLP1;RPL22;RPL36A;RPS17;RPS27;RPL37A;RP... |
| 32 | GO_Biological_Process_2021 | regulation of cytokine production (GO:0001817) | 13/150 | 9.854661e-06 | 7.979289e-04 | 0 | 0 | 4.797516 | 55.303687 | SRGN;PTGER4;ITK;ANXA1;ISG15;MIF;TNFRSF1B;BATF;... |
| 33 | GO_Biological_Process_2021 | regulation of mRNA splicing, via spliceosome (... | 10/90 | 1.207072e-05 | 9.486168e-04 | 0 | 0 | 6.289304 | 71.224656 | HNRNPL;PTBP1;RBM4;RBM39;RBM8A;WTAP;NUP98;PRDX6... |
| 35 | GO_Biological_Process_2021 | RNA metabolic process (GO:0016070) | 12/133 | 1.438041e-05 | 1.059935e-03 | 0 | 0 | 5.005181 | 55.805989 | HNRNPL;ISG20;PTBP1;RBM4;RBM39;HNRNPUL1;DDX24;P... |
| 36 | GO_Biological_Process_2021 | RNA processing (GO:0006396) | 14/179 | 1.467725e-05 | 1.059935e-03 | 0 | 0 | 4.294792 | 47.797647 | IVNS1ABP;RBM39;RBM8A;HNRNPL;PPP2CA;PTBP1;RBM4;... |
| 39 | GO_Biological_Process_2021 | positive regulation of transcription, DNA-temp... | 45/1183 | 2.349261e-05 | 1.544045e-03 | 0 | 0 | 2.068337 | 22.046043 | ARF4;RNF10;TMF1;CITED2;HMGB2;RORA;YBX1;RBPJ;NR... |
| 40 | GO_Biological_Process_2021 | TRIF-dependent toll-like receptor signaling pa... | 6/30 | 2.369231e-05 | 1.544045e-03 | 0 | 0 | 12.485969 | 132.980068 | UBB;UBE2D3;IRF7;TANK;BIRC2;BIRC3 |
| 41 | GO_Biological_Process_2021 | cellular response to copper ion (GO:0071280) | 5/19 | 2.811179e-05 | 1.746854e-03 | 0 | 0 | 17.800800 | 186.540302 | PRNP;MT2A;MT1F;MT1X;MT1E |
| 42 | GO_Biological_Process_2021 | negative regulation of T cell receptor signali... | 5/19 | 2.811179e-05 | 1.746854e-03 | 0 | 0 | 17.800800 | 186.540302 | PRNP;LGALS3;PTPN22;SLA2;EZR |
| 43 | GO_Biological_Process_2021 | MyD88-independent toll-like receptor signaling... | 6/31 | 2.888869e-05 | 1.754331e-03 | 0 | 0 | 11.985918 | 125.277543 | UBB;UBE2D3;IRF7;TANK;BIRC2;BIRC3 |
| 45 | GO_Biological_Process_2021 | positive regulation of gene expression (GO:001... | 24/482 | 4.003948e-05 | 2.325771e-03 | 0 | 0 | 2.682297 | 27.159985 | PTGER4;ITK;TGFB1;CITED2;EIF4A3;DDX21;SERPINB9;... |
| 46 | GO_Biological_Process_2021 | response to sterol (GO:0036314) | 4/11 | 4.563081e-05 | 2.594160e-03 | 0 | 0 | 28.419144 | 284.047287 | TGFB1;INSIG1;RORA;TGFBR2 |
| 47 | GO_Biological_Process_2021 | positive regulation of transcription by RNA po... | 36/908 | 7.038646e-05 | 3.918180e-03 | 0 | 0 | 2.136069 | 20.424042 | ARF4;RNF10;TMF1;CITED2;HMGB2;RORA;YBX1;RBPJ;NR... |
| 48 | GO_Biological_Process_2021 | positive regulation of transcription from RNA ... | 3/5 | 7.592191e-05 | 4.071335e-03 | 0 | 0 | 74.430380 | 706.032084 | RBPJ;HIF1A;NFE2L2 |
| 49 | GO_Biological_Process_2021 | response to copper ion (GO:0046688) | 5/23 | 7.618517e-05 | 4.071335e-03 | 0 | 0 | 13.842239 | 131.256871 | PRNP;MT2A;MT1F;MT1X;MT1E |
| 50 | GO_Biological_Process_2021 | regulation of cell cycle (GO:0051726) | 17/296 | 9.894100e-05 | 5.183732e-03 | 0 | 0 | 3.090255 | 28.495199 | TSPYL2;CDKN1B;TGFB1;GADD45B;CITED2;MIF;RUNX3;S... |
| 51 | GO_Biological_Process_2021 | regulation of T cell differentiation (GO:0045580) | 6/39 | 1.119261e-04 | 5.751280e-03 | 0 | 0 | 9.076531 | 82.575295 | IFNG;CAMK4;ZBTB1;CTLA4;PRDM1;SOD1 |
| 52 | GO_Biological_Process_2021 | negative regulation of antigen receptor-mediat... | 5/25 | 1.164166e-04 | 5.869155e-03 | 0 | 0 | 12.456743 | 112.837353 | LGALS3;PRNP;PTPN22;SLA2;EZR |
| 53 | GO_Biological_Process_2021 | regulation of RNA splicing (GO:0043484) | 8/76 | 1.326985e-04 | 6.566120e-03 | 0 | 0 | 5.892609 | 52.605861 | CLK1;HNRNPL;RPS26;PTBP1;RBM39;POLR2A;JMJD6;SF1 |
| 55 | GO_Biological_Process_2021 | positive regulation of type I interferon produ... | 8/77 | 1.455511e-04 | 6.944865e-03 | 0 | 0 | 5.806912 | 51.303972 | RIOK3;DHX36;IRF7;PTPN22;ISG15;GAPDH;HSPD1;NFKB2 |
| 56 | GO_Biological_Process_2021 | negative regulation of intracellular signal tr... | 13/198 | 1.764191e-04 | 8.270030e-03 | 0 | 0 | 3.543994 | 30.629497 | MAP2K3;UBE2B;RIOK3;PDE4D;PDE3B;RORA;PPP2R5C;SL... |
| 59 | GO_Biological_Process_2021 | apoptotic process (GO:0006915) | 14/231 | 2.317475e-04 | 1.032049e-02 | 0 | 0 | 3.256888 | 27.259707 | MX1;IFI6;CXCR4;GZMB;TGFBR2;HSPD1;PPP2CA;PLSCR1... |
| 60 | GO_Biological_Process_2021 | regulation of gene expression (GO:0010468) | 39/1079 | 2.421804e-04 | 1.033753e-02 | 0 | 0 | 1.938928 | 16.143177 | ZNF331;CITED2;SRRT;CREM;JMJD1C;RORA;PTPN22;PRD... |
| 62 | GO_Biological_Process_2021 | response to zinc ion (GO:0010043) | 5/29 | 2.437367e-04 | 1.033753e-02 | 0 | 0 | 10.378499 | 86.343110 | MT2A;MT1F;MT1X;CRIP1;MT1E |
| 63 | GO_Biological_Process_2021 | transcription by RNA polymerase II (GO:0006366) | 17/320 | 2.504733e-04 | 1.045726e-02 | 0 | 0 | 2.841948 | 23.565882 | SLBP;CCNH;RNMT;NR1H2;GTF2B;SRRT;ZBTB1;DDX21;RO... |
| 65 | GO_Biological_Process_2021 | regulation of innate immune response (GO:0045088) | 7/64 | 2.743734e-04 | 1.095018e-02 | 0 | 0 | 6.138780 | 50.344264 | AKIRIN2;PTPN1;PLSCR1;RIOK3;PTPN22;BIRC2;BIRC3 |
| 66 | GO_Biological_Process_2021 | negative regulation of cellular macromolecule ... | 24/547 | 2.745742e-04 | 1.095018e-02 | 0 | 0 | 2.340958 | 19.196529 | TSPYL2;CDKN1B;TGFB1;CITED2;NR1H2;EIF4A3;HMGA1;... |
| 67 | GO_Biological_Process_2021 | postreplication repair (GO:0006301) | 6/46 | 2.858004e-04 | 1.123027e-02 | 0 | 0 | 7.485459 | 61.082971 | UBB;UBE2B;ZBTB1;ISG15;UBE2A;UBE2V1 |
| 68 | GO_Biological_Process_2021 | negative regulation of cellular amide metaboli... | 8/86 | 3.142995e-04 | 1.217114e-02 | 0 | 0 | 5.134517 | 41.410720 | RBM4;PRNP;EIF4A3;DHX36;GZMB;YBX1;GAPDH;TOB1 |
| 69 | GO_Biological_Process_2021 | cellular response to zinc ion (GO:0071294) | 4/18 | 3.788618e-04 | 1.446170e-02 | 0 | 0 | 14.204496 | 111.907836 | MT2A;MT1F;MT1X;MT1E |
| 71 | GO_Biological_Process_2021 | regulation of RIG-I signaling pathway (GO:0039... | 4/19 | 4.723957e-04 | 1.739863e-02 | 0 | 0 | 13.256853 | 101.516916 | SEC14L1;BIRC2;OASL;BIRC3 |
| 73 | GO_Biological_Process_2021 | regulation of peptidyl-tyrosine phosphorylatio... | 8/92 | 4.972926e-04 | 1.795630e-02 | 0 | 0 | 4.766300 | 36.254063 | PRNP;PDCL3;TGFB1;SEMA4D;FYN;MIF;SAMSN1;CD44 |
| 74 | GO_Biological_Process_2021 | nucleic acid metabolic process (GO:0090304) | 7/71 | 5.215188e-04 | 1.857998e-02 | 0 | 0 | 5.465393 | 41.311624 | HNRNPL;PTBP1;DDX24;POLR2A;WTAP;KPNA2;HNRNPA0 |
| 76 | GO_Biological_Process_2021 | RNA splicing (GO:0008380) | 8/98 | 7.584158e-04 | 2.542252e-02 | 0 | 0 | 4.447179 | 31.949777 | IVNS1ABP;PPP2CA;PTBP1;SFPQ;RBM8A;SRSF2;BCAS2;S... |
| 78 | GO_Biological_Process_2021 | pyruvate metabolic process (GO:0006090) | 6/55 | 7.611532e-04 | 2.542252e-02 | 0 | 0 | 6.107768 | 43.857900 | LDHB;LDHA;PGK1;VDAC1;ALDOA;GAPDH |
| 79 | GO_Biological_Process_2021 | regulation of blood vessel endothelial cell mi... | 6/55 | 7.611532e-04 | 2.542252e-02 | 0 | 0 | 6.107768 | 43.857900 | MAP2K3;STAT5A;TGFB1;RGCC;CSNK2B;HIF1A |
itgae_ls[3].res2d.Term = itgae_ls[3].res2d.Term.str.split(" \(GO").str[0]
## dotplot
gseapy.dotplot(itgae_ls[3].res2d.iloc[[32,55,65,84],:],
               size=50, top_term=10, title='Up',
               cmap=make_colormap(['#f7f7f7', '#e5aca5']),
               figsize=(3,5), vmin=1.3)

plt.savefig('figures/Nitgae_go_up.pdf')
plt.show()
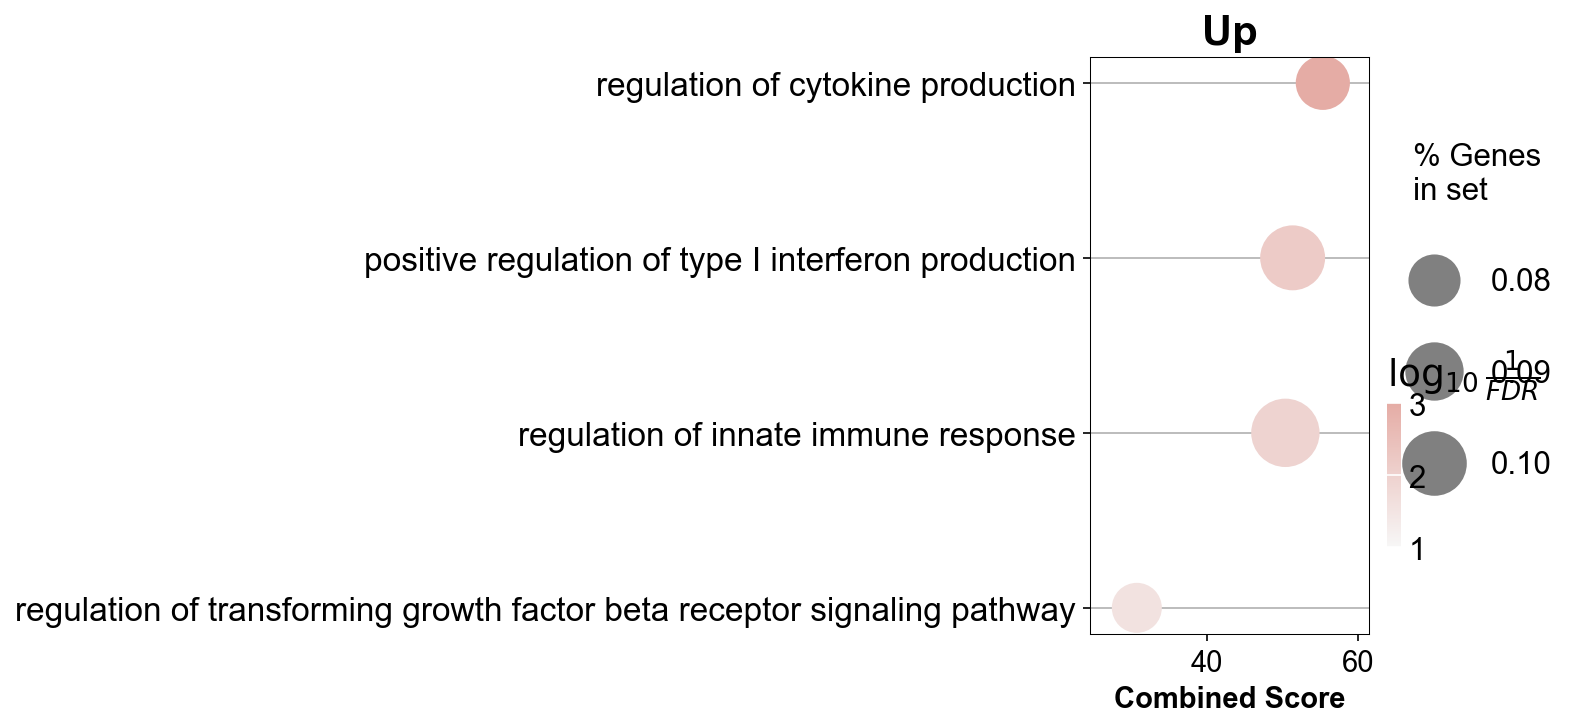
xbp_go_inter = xbp_go.append([gzmk_go,itgae_go])
xbp_go_inter = xbp_go_inter.drop_duplicates(['Term'], keep=False)
xbp_go_inter[0:50]
| Gene_set | Term | Overlap | P-value | Adjusted P-value | Old P-value | Old Adjusted P-value | Odds Ratio | Combined Score | Genes | |
|---|---|---|---|---|---|---|---|---|---|---|
| 3 | GO_Biological_Process_2021 | protein transport (GO:0015031) | 45/369 | 3.924420e-10 | 3.580052e-07 | 0 | 0 | 3.178055 | 68.832322 | MACF1;COPB2;COPA;CLTC;USO1;MIA2;VPS26A;HSP90B1... |
| 4 | GO_Biological_Process_2021 | mitochondrial respiratory chain complex I asse... | 15/58 | 1.652156e-08 | 1.004786e-05 | 0 | 0 | 7.816083 | 140.053256 | NDUFB9;NDUFA8;NDUFB7;NDUFB10;NDUFA12;NDUFB5;ND... |
| 5 | GO_Biological_Process_2021 | NADH dehydrogenase complex assembly (GO:0010257) | 15/58 | 1.652156e-08 | 1.004786e-05 | 0 | 0 | 7.816083 | 140.053256 | NDUFB9;NDUFA8;NDUFB7;NDUFB10;NDUFA12;NDUFB5;ND... |
| 6 | GO_Biological_Process_2021 | cellular protein localization (GO:0034613) | 38/329 | 4.001543e-08 | 2.085947e-05 | 0 | 0 | 2.967994 | 50.556819 | CD63;COPB2;COPA;CLTC;USO1;VPS26A;MESD;GGA1;SNX... |
| 7 | GO_Biological_Process_2021 | mitochondrial ATP synthesis coupled electron t... | 16/71 | 4.625599e-08 | 2.109851e-05 | 0 | 0 | 6.521696 | 110.145419 | NDUFB9;NDUFA8;NDUFB7;NDUFB10;NDUFA12;NDUFB5;ND... |
| 8 | GO_Biological_Process_2021 | mitochondrial electron transport, NADH to ubiq... | 12/39 | 5.410310e-08 | 2.193580e-05 | 0 | 0 | 9.931644 | 166.179985 | NDUFB9;NDUFA8;NDUFB7;NDUFS8;NDUFB10;NDUFA12;ND... |
| 10 | GO_Biological_Process_2021 | aerobic electron transport chain (GO:0019646) | 15/70 | 2.463931e-07 | 8.173532e-05 | 0 | 0 | 6.106914 | 92.924868 | NDUFB9;NDUFA8;NDUFB7;NDUFB10;NDUFA12;NDUFB5;ND... |
| 12 | GO_Biological_Process_2021 | positive regulation of cellular component biog... | 17/92 | 3.815916e-07 | 1.071098e-04 | 0 | 0 | 5.082133 | 75.108416 | PDCD6IP;SMAD3;TGFB1;PIH1D1;VPS4B;PLEK;BRK1;PRK... |
| 14 | GO_Biological_Process_2021 | translational elongation (GO:0006414) | 18/104 | 4.843540e-07 | 1.178272e-04 | 0 | 0 | 4.695620 | 68.276427 | MRPS15;MRPS12;MRPS34;MRPS18B;MRPL28;MRPL36;EEF... |
| 15 | GO_Biological_Process_2021 | cellular protein modification process (GO:0006... | 78/1025 | 8.951947e-07 | 2.041603e-04 | 0 | 0 | 1.898475 | 26.438585 | ERO1A;GPAA1;PRKCSH;GMFG;PIK3CD;ILK;DCAF7;STK10... |
| 16 | GO_Biological_Process_2021 | retrograde transport, endosome to Golgi (GO:00... | 16/88 | 1.049169e-06 | 2.252010e-04 | 0 | 0 | 4.977412 | 68.526583 | TMED9;CLTC;VPS26A;SNX3;GGA1;LMAN1;SNX1;VPS51;T... |
| 17 | GO_Biological_Process_2021 | mitochondrial translational elongation (GO:007... | 16/89 | 1.228316e-06 | 2.359014e-04 | 0 | 0 | 4.908971 | 66.810438 | MRPS15;MRPS12;MRPS34;MRPS18B;MRPL28;MRPL36;MRP... |
| 18 | GO_Biological_Process_2021 | mitochondrial translational termination (GO:00... | 16/89 | 1.228316e-06 | 2.359014e-04 | 0 | 0 | 4.908971 | 66.810438 | MRPS15;MRPS12;MRPS34;MRPS18B;MRPL28;MRPL36;MRP... |
| 19 | GO_Biological_Process_2021 | mitochondrial respiratory chain complex assemb... | 16/90 | 1.434568e-06 | 2.617370e-04 | 0 | 0 | 4.842379 | 65.152503 | NDUFB9;COA3;NDUFA8;NDUFB7;NDUFB10;NDUFA12;NDUF... |
| 20 | GO_Biological_Process_2021 | protein-containing complex assembly (GO:0065003) | 30/267 | 1.892660e-06 | 3.288722e-04 | 0 | 0 | 2.857705 | 37.657481 | CDC123;STOML2;KMT2A;GPAA1;TUBGCP2;TRADD;USO1;W... |
| 21 | GO_Biological_Process_2021 | cytosolic transport (GO:0016482) | 18/116 | 2.515784e-06 | 4.150968e-04 | 0 | 0 | 4.118050 | 53.093714 | VPS13C;CLTC;VPS13A;VPS26A;SNF8;GGA1;SNX1;VPS51... |
| 22 | GO_Biological_Process_2021 | mitochondrial translation (GO:0032543) | 17/105 | 2.616395e-06 | 4.150968e-04 | 0 | 0 | 4.328409 | 55.636128 | MRPS15;MRPS12;MRPS34;MRPS18B;MRPL28;MRPL36;MTI... |
| 23 | GO_Biological_Process_2021 | regulation of autophagy (GO:0010506) | 27/231 | 2.896170e-06 | 4.403385e-04 | 0 | 0 | 2.982511 | 38.033336 | PLEKHF1;ROCK1;CISD2;VPS26A;MTDH;CAPNS1;RB1CC1;... |
| 25 | GO_Biological_Process_2021 | translational termination (GO:0006415) | 16/96 | 3.470882e-06 | 4.871250e-04 | 0 | 0 | 4.477791 | 56.290764 | MRPS15;MRPS12;MRPS34;MRPS18B;MRPL28;MRPL36;MRP... |
| 26 | GO_Biological_Process_2021 | peptidyl-serine phosphorylation (GO:0018105) | 21/156 | 3.987270e-06 | 5.388721e-04 | 0 | 0 | 3.493197 | 43.428833 | SRPK2;MAP4K1;MAP2K2;CAB39;ROCK1;PRKCB;PRKDC;PR... |
| 27 | GO_Biological_Process_2021 | intracellular protein transport (GO:0006886) | 34/336 | 4.275271e-06 | 5.571594e-04 | 0 | 0 | 2.545074 | 31.463888 | COPB2;COPA;CLTC;USO1;VPS26A;GGA1;LMAN1;SNX1;TP... |
| 30 | GO_Biological_Process_2021 | T cell activation (GO:0042110) | 15/92 | 9.200493e-06 | 1.082987e-03 | 0 | 0 | 4.357051 | 50.525472 | TNFSF14;PIK3CD;MSN;NLRC3;RASGRP1;DDOST;DPP4;ZA... |
| 32 | GO_Biological_Process_2021 | endocytic recycling (GO:0032456) | 11/52 | 1.127685e-05 | 1.246947e-03 | 0 | 0 | 5.983930 | 68.173466 | ARL4C;SNX3;EHD1;VPS51;SNX17;VPS35;VPS26A;SNF8;... |
| 33 | GO_Biological_Process_2021 | protein localization to membrane (GO:0072657) | 23/195 | 1.331277e-05 | 1.428774e-03 | 0 | 0 | 3.004126 | 33.726684 | PLEKHF1;ITGA4;ROCK1;CD81;TESC;ITGB2;ITGAL;TNF;... |
| 34 | GO_Biological_Process_2021 | homotypic cell-cell adhesion (GO:0034109) | 10/44 | 1.442079e-05 | 1.457168e-03 | 0 | 0 | 6.554671 | 73.063865 | PLEK;GNAS;ILK;FLNA;MYH9;TLN1;CLIC1;MYL12A;CD99... |
| 37 | GO_Biological_Process_2021 | platelet aggregation (GO:0070527) | 9/36 | 1.697354e-05 | 1.605428e-03 | 0 | 0 | 7.422688 | 81.529731 | PLEK;GNAS;ILK;FLNA;MYH9;TLN1;CLIC1;MYL12A;FERMT3 |
| 40 | GO_Biological_Process_2021 | membrane raft organization (GO:0031579) | 6/15 | 2.331139e-05 | 2.074713e-03 | 0 | 0 | 14.807588 | 157.946154 | ANXA2;NAXE;FLOT1;PPT1;FLOT2;S100A10 |
| 41 | GO_Biological_Process_2021 | post-Golgi vesicle-mediated transport (GO:0006... | 14/89 | 2.758841e-05 | 2.396907e-03 | 0 | 0 | 4.170567 | 43.783088 | VPS13C;CLTC;VPS13A;CLTA;SORL1;SCAMP3;BLOC1S4;R... |
| 42 | GO_Biological_Process_2021 | pinocytosis (GO:0006907) | 5/10 | 3.178643e-05 | 2.636106e-03 | 0 | 0 | 22.190255 | 229.812738 | PYCARD;MAPKAPK3;PPT1;DOCK2;SNX5 |
| 44 | GO_Biological_Process_2021 | positive regulation of cellular protein metabo... | 15/102 | 3.274641e-05 | 2.655370e-03 | 0 | 0 | 3.854217 | 39.801412 | CYFIP2;TGFB1;PRKDC;MSN;RPS27L;UPF3A;EEF2;CASP8... |
| 45 | GO_Biological_Process_2021 | positive regulation of transport (GO:0051050) | 14/91 | 3.563529e-05 | 2.826808e-03 | 0 | 0 | 4.061814 | 41.601806 | DYNC1H1;ANXA1;ANXA2;KMT2A;CHCHD10;CYBA;TNF;PYC... |
| 47 | GO_Biological_Process_2021 | peptidyl-serine modification (GO:0018209) | 20/169 | 4.555246e-05 | 3.442080e-03 | 0 | 0 | 3.008486 | 30.074773 | SRPK2;MAP4K1;PARP1;CAB39;ROCK1;PRKCB;PRKDC;PRK... |
| 48 | GO_Biological_Process_2021 | cellular protein catabolic process (GO:0044257) | 11/60 | 4.662983e-05 | 3.442080e-03 | 0 | 0 | 5.004864 | 49.914857 | CASP8;GZMA;CLTC;CAPN2;AP2S1;MDM2;CLTA;GZMB;CTS... |
| 49 | GO_Biological_Process_2021 | positive regulation of cellular process (GO:00... | 49/625 | 4.800483e-05 | 3.442080e-03 | 0 | 0 | 1.929870 | 19.191031 | CD81;TNF;CCAR1;MECP2;PYCARD;CAPNS1;RPS19;RPS6K... |
| 50 | GO_Biological_Process_2021 | membrane raft assembly (GO:0001765) | 4/6 | 4.905129e-05 | 3.442080e-03 | 0 | 0 | 44.336037 | 439.930715 | ANXA2;FLOT1;FLOT2;S100A10 |
| 51 | GO_Biological_Process_2021 | positive regulation of granulocyte differentia... | 4/6 | 4.905129e-05 | 3.442080e-03 | 0 | 0 | 44.336037 | 439.930715 | HAX1;TESC;HCLS1;EVI2B |
| 52 | GO_Biological_Process_2021 | endoplasmic reticulum to Golgi vesicle-mediate... | 21/185 | 5.511899e-05 | 3.794890e-03 | 0 | 0 | 2.871108 | 28.154131 | COPB2;DYNC1H1;COPA;TMED9;TRAPPC1;DCTN2;KDELR1;... |
| 53 | GO_Biological_Process_2021 | regulation of T cell apoptotic process (GO:007... | 5/11 | 5.619272e-05 | 3.797171e-03 | 0 | 0 | 18.490913 | 180.965448 | LGALS3;PRELID1;CCL5;PRKCQ;JAK3 |
| 55 | GO_Biological_Process_2021 | protein phosphorylation (GO:0006468) | 41/496 | 6.211135e-05 | 4.020727e-03 | 0 | 0 | 2.037618 | 19.737554 | ROCK1;CAB39;PRKDC;GMFG;PIK3CD;ILK;STK10;RPS6KA... |
| 56 | GO_Biological_Process_2021 | regulation of cell adhesion (GO:0030155) | 17/133 | 6.326954e-05 | 4.020727e-03 | 0 | 0 | 3.278793 | 31.699721 | RIPOR2;PPP1R12A;ROCK1;TESC;PDE3B;ADAM10;PRKCA;... |
| 58 | GO_Biological_Process_2021 | regulation of spindle assembly (GO:0090169) | 7/25 | 6.797320e-05 | 4.188690e-03 | 0 | 0 | 8.643734 | 82.948702 | SENP6;DYNC1H1;PDCD6IP;VPS4B;TPR;CHMP2A;CHMP4B |
| 59 | GO_Biological_Process_2021 | phosphorylation (GO:0016310) | 35/400 | 6.887405e-05 | 4.188690e-03 | 0 | 0 | 2.163066 | 20.729165 | ROCK1;PRKDC;GMFG;PIK3CD;ILK;STK10;RPS6KA5;GRK2... |
| 60 | GO_Biological_Process_2021 | proteolysis involved in cellular protein catab... | 12/74 | 7.521338e-05 | 4.435290e-03 | 0 | 0 | 4.317148 | 40.992101 | DDB1;CASP8;PDCD6IP;VPS4B;GZMA;CAPN2;MDM2;CHMP4... |
| 62 | GO_Biological_Process_2021 | leukocyte tethering or rolling (GO:0050901) | 6/18 | 7.730898e-05 | 4.477785e-03 | 0 | 0 | 11.103949 | 105.128862 | SPN;SELPLG;ITGA4;ROCK1;ITGB7;TNF |
| 63 | GO_Biological_Process_2021 | IRE1-mediated unfolded protein response (GO:00... | 10/53 | 7.960779e-05 | 4.538888e-03 | 0 | 0 | 5.180321 | 48.893932 | DNAJC3;ERN1;MYDGF;ACADVL;XBP1;SSR1;TPP1;TLN1;P... |
| 67 | GO_Biological_Process_2021 | cytoplasmic translational initiation (GO:0002183) | 6/19 | 1.088592e-04 | 5.679776e-03 | 0 | 0 | 10.249263 | 93.529190 | MCTS1;EIF3M;EIF2S2;EIF3A;EIF4B;EIF4G1 |
| 68 | GO_Biological_Process_2021 | leukocyte adhesion to vascular endothelial cel... | 6/19 | 1.088592e-04 | 5.679776e-03 | 0 | 0 | 10.249263 | 93.529190 | SPN;SELPLG;ITGA4;ROCK1;ITGB7;TNF |
| 69 | GO_Biological_Process_2021 | death-inducing signaling complex assembly (GO:... | 4/7 | 1.105136e-04 | 5.679776e-03 | 0 | 0 | 29.555813 | 269.264455 | CASP8;TRADD;TNF;TNFRSF1A |
| 70 | GO_Biological_Process_2021 | regulation of myosin-light-chain-phosphatase a... | 4/7 | 1.105136e-04 | 5.679776e-03 | 0 | 0 | 29.555813 | 269.264455 | PPP1R12A;ROCK1;NCKAP1L;TNF |
| 72 | GO_Biological_Process_2021 | vascular endothelial growth factor receptor si... | 11/67 | 1.326708e-04 | 6.631723e-03 | 0 | 0 | 4.377649 | 39.082076 | CYFIP2;MAPKAPK3;ROCK1;NCF4;PXN;BRK1;CYBA;NCKAP... |
xbp_ls[3].res2d.Term = xbp_ls[3].res2d.Term.str.split(" \(GO").str[0]
## dotplot
gseapy.dotplot(xbp_ls[3].res2d.iloc[[23,56,68,86],:],
               size=20, top_term=20, title='Up', vmin=1.3,
               cmap=make_colormap(['#dee0c1','#949b0d']),
               figsize=(3,5))

plt.savefig('figures/XBP1_go_up.pdf')
plt.show()
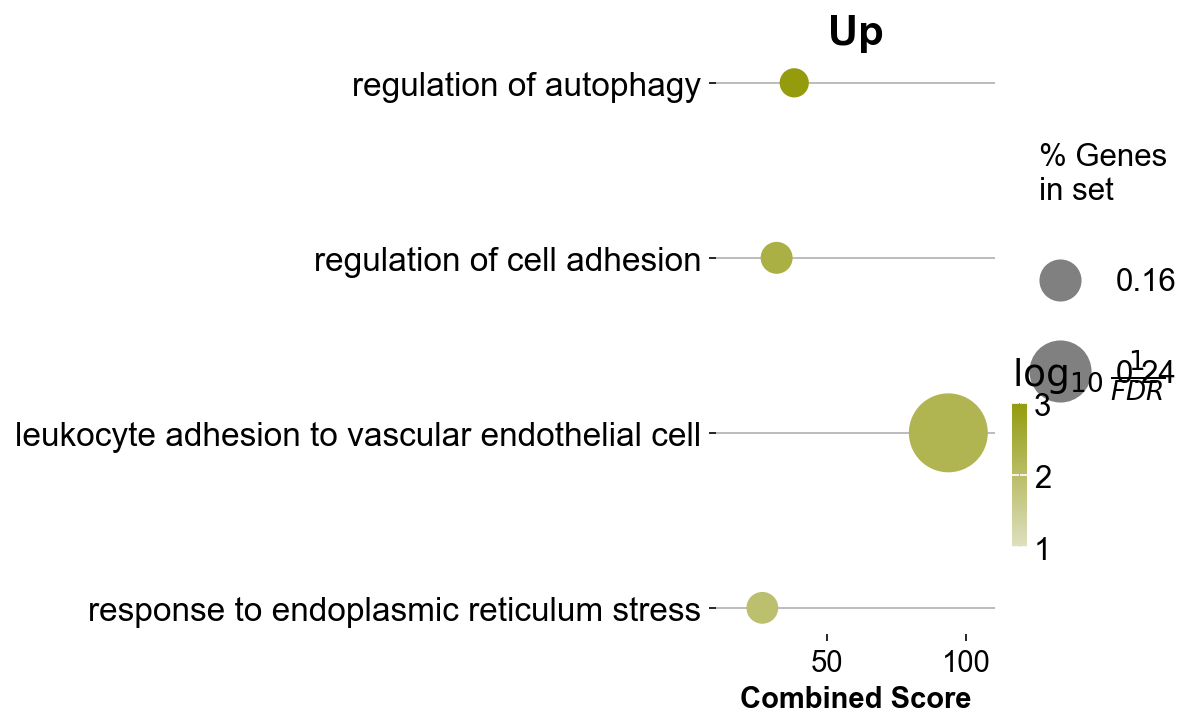
gzmk_final = gzmk_ls[3].res2d.iloc[[0,18,21,52],:]
itgae_final = itgae_ls[3].res2d.iloc[[32,55,65,84],:]
xbp_final = xbp_ls[3].res2d.iloc[[23,56,68,86],:]
fig2_goterm = gzmk_final.append([itgae_final,xbp_final])
fig2_goterm.to_csv('tables/fig2_goterm.csv', index=0)
Clonotype Sharing Analysis
clone_stumor = clone_subtype[(clone_subtype['disease_type']=='Solid tumor') &
                             (clone_subtype['meta_cell_subset']=='normal_CD8')]
cell_subtypes_mod = [
    'GZMK+ Tex',
    'ITGAE+ Tex',
    'XBP1+ Tex',
    'Tn',
    'Tcm',
    'Early Tcm/Tem',
    'GZMK+ Tem',
    'GNLY+ Temra',
    'CMC1+ Temra',
    'ZNF683+ Teff',
    'MAIT',
    'ILTCK',
    'ITGAE+ Trm',
    'CREM+ Trm',
    'ITGB2+ Trm',
    'Tpex',
    'MACF1+ T',
    'Cycling T'
]
stumor_circos = circos_edges(clone_stumor,
                             subtypes=cell_subtypes_mod,
                             file_name='figures/stumor_clonotype.csv')
Venn3
stumor_sanke, stumor_sanke_venn = sanke_plot3(
    stumor_circos,
    column1='GZMK+ Tex',
    column2='ITGAE+ Tex',
    column3='XBP1+ Tex',
    file_name='figures/stumor_sanke3.csv')
stumor_sanke
| source | target | value | sg | tg | value_raw | |
|---|---|---|---|---|---|---|
| 3 | GZMK+ Tex | Tcm | 0.161551 | 0 | 1 | 1 |
| 5 | GZMK+ Tex | GZMK+ Tem | 14.539580 | 0 | 1 | 90 |
| 6 | GZMK+ Tex | GNLY+ Temra | 0.807754 | 0 | 1 | 5 |
| 7 | GZMK+ Tex | CMC1+ Temra | 7.592892 | 0 | 1 | 47 |
| 8 | GZMK+ Tex | ZNF683+ Teff | 0.484653 | 0 | 1 | 3 |
| 9 | GZMK+ Tex | MAIT | 0.323102 | 0 | 1 | 2 |
| 10 | GZMK+ Tex | ILTCK | 0.323102 | 0 | 1 | 2 |
| 11 | GZMK+ Tex | ITGAE+ Trm | 1.938611 | 0 | 1 | 12 |
| 12 | GZMK+ Tex | CREM+ Trm | 26.978998 | 0 | 1 | 167 |
| 13 | GZMK+ Tex | ITGB2+ Trm | 44.749596 | 0 | 1 | 277 |
| 14 | GZMK+ Tex | Tpex | 0.969305 | 0 | 1 | 6 |
| 15 | GZMK+ Tex | MACF1+ T | 1.130856 | 0 | 1 | 7 |
| 18 | ITGAE+ Tex | Tn | 0.323102 | 0 | 1 | 2 |
| 19 | ITGAE+ Tex | Tcm | 1.292407 | 0 | 1 | 8 |
| 20 | ITGAE+ Tex | Early Tcm/Tem | 1.615509 | 0 | 1 | 10 |
| 21 | ITGAE+ Tex | GZMK+ Tem | 1.130856 | 0 | 1 | 7 |
| 22 | ITGAE+ Tex | GNLY+ Temra | 4.361874 | 0 | 1 | 27 |
| 23 | ITGAE+ Tex | CMC1+ Temra | 2.907916 | 0 | 1 | 18 |
| 24 | ITGAE+ Tex | ZNF683+ Teff | 24.232633 | 0 | 1 | 150 |
| 25 | ITGAE+ Tex | MAIT | 0.969305 | 0 | 1 | 6 |
| 26 | ITGAE+ Tex | ILTCK | 0.161551 | 0 | 1 | 1 |
| 27 | ITGAE+ Tex | ITGAE+ Trm | 82.875606 | 0 | 1 | 513 |
| 28 | ITGAE+ Tex | CREM+ Trm | 25.040388 | 0 | 1 | 155 |
| 29 | ITGAE+ Tex | ITGB2+ Trm | 17.124394 | 0 | 1 | 106 |
| 30 | ITGAE+ Tex | Tpex | 0.161551 | 0 | 1 | 1 |
| 31 | ITGAE+ Tex | MACF1+ T | 8.885299 | 0 | 1 | 55 |
| 34 | XBP1+ Tex | Tcm | 0.646204 | 0 | 1 | 4 |
| 35 | XBP1+ Tex | Early Tcm/Tem | 1.453958 | 0 | 1 | 9 |
| 36 | XBP1+ Tex | GZMK+ Tem | 7.108239 | 0 | 1 | 44 |
| 37 | XBP1+ Tex | GNLY+ Temra | 1.130856 | 0 | 1 | 7 |
| 38 | XBP1+ Tex | CMC1+ Temra | 2.423263 | 0 | 1 | 15 |
| 39 | XBP1+ Tex | ZNF683+ Teff | 53.311793 | 0 | 1 | 330 |
| 40 | XBP1+ Tex | MAIT | 1.130856 | 0 | 1 | 7 |
| 42 | XBP1+ Tex | ITGAE+ Trm | 3.231018 | 0 | 1 | 20 |
| 43 | XBP1+ Tex | CREM+ Trm | 0.484653 | 0 | 1 | 3 |
| 44 | XBP1+ Tex | ITGB2+ Trm | 1.615509 | 0 | 1 | 10 |
stumor_sanke_venn
[619, 1059, 478, 449, 86, 82, 0]
venn3(subsets=stumor_sanke_venn,
      set_labels=['GZMK+ Tex', 'ITGAE+ Tex', 'XBP1+ Tex'],
      set_colors=['#082799', '#d67e09', '#6b7cad'])
plt.savefig('figures/stumor_venn3.pdf')
plt.show()
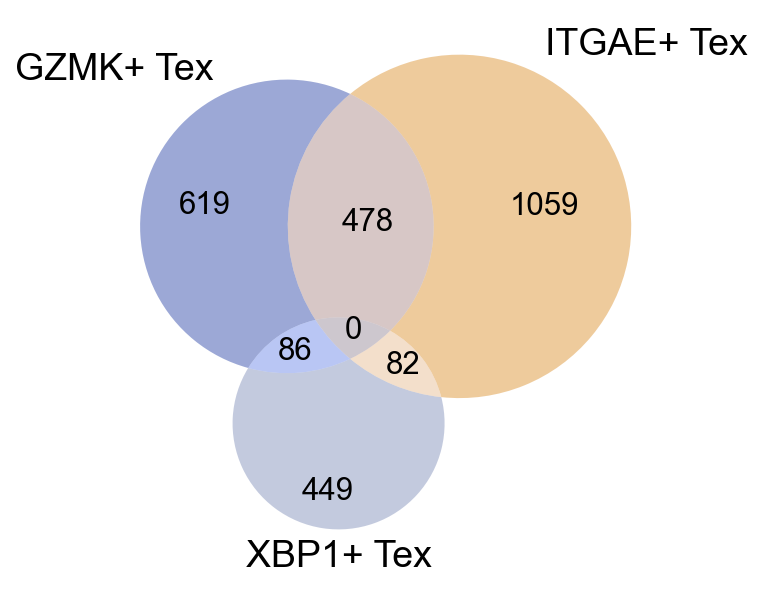
## Figure2E Stats and Plots
clone_id_name = {
    'GZMK1_ccRCC':90249,
    'GZMK2_NPC':34940,
    'ITGAE1_NPC':103807,
    'ITGAE2_NSCLC':425078,
    'XBP1_PCC':251863,
    'XBP2_PCC':251324,
}

for file_name, clone_id in zip(clone_id_name.keys(),clone_id_name.values()):
    adata_nogex.obs['clone_umap'] = None
    adata_nogex.obs.loc[
        (
            adata_nogex.obs['cc_aa_identity']==clone_id
        ), 'clone_umap'
    ] = adata_nogex.obs.cell_subtype_3

    ## Figure2E

    fig,ax = plt.subplots(figsize=(5,5))
    sc.pl.umap(adata_nogex, color='clone_umap', palette=subtype_color,
               size=100, na_color='#f3f3f3', ax=ax)
    fig.savefig('figures/fig3_updated/single_clone_'+file_name+'.png', dpi=600)

    subtype_used = np.unique(adata_nogex.obs[~adata_nogex.obs['clone_umap'].isna()]['clone_umap'])
    subtype_used = np.setdiff1d(subtype_used, 'Cycling T')
    clone_pie = tissue_pie_data(adata_use=adata_nogex,
                                groupby='atlas_name',
                                groupby_type='huARdbv2',
                                ratioby='clone_umap',
                                ratioby_type=subtype_used,
                                expanded=False)
    clone_pie_dict = dict(zip(subtype_used, clone_pie[0][:-1]))
    clone_pie_tuple = sorted(clone_pie_dict.items(), key=lambda item: item[1], reverse=True)
    clone_pie_keys = [x[0] for x in clone_pie_tuple]
    clone_pie_values = [x[1] for x in clone_pie_tuple]

    fig,ax = plt.subplots(figsize=(5,3))
    ax.pie(clone_pie_values, radius=1,
           colors=list(map(subtype_color.get, clone_pie_keys)),
           autopct='%1.0f%%', pctdistance=1.2)
    fig.savefig('figures/fig3_updated/single_clone_'+file_name+'.pie.pdf')
    plt.show()
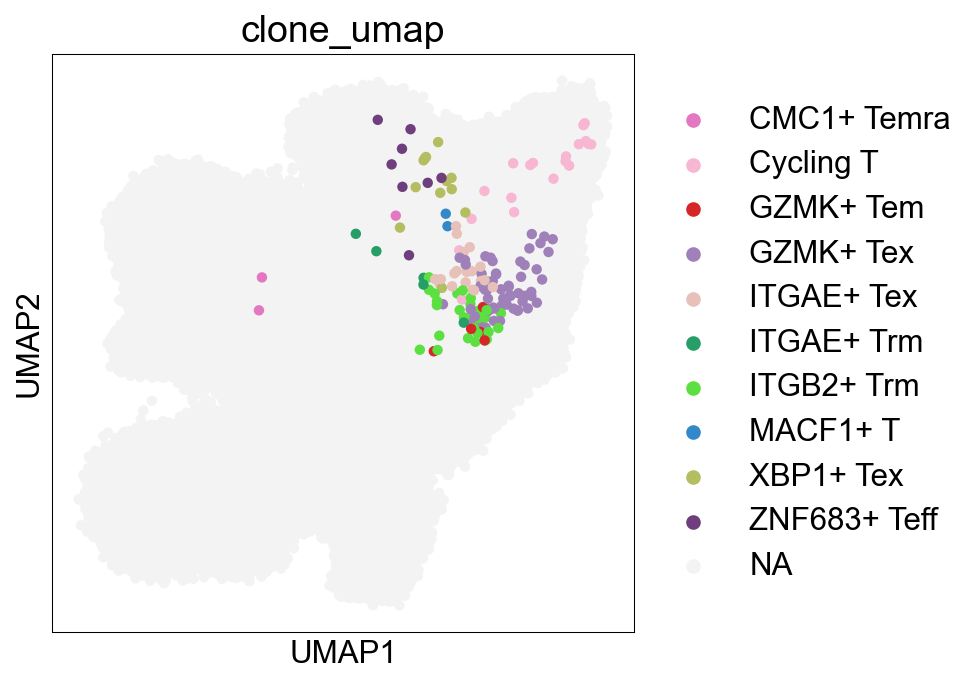
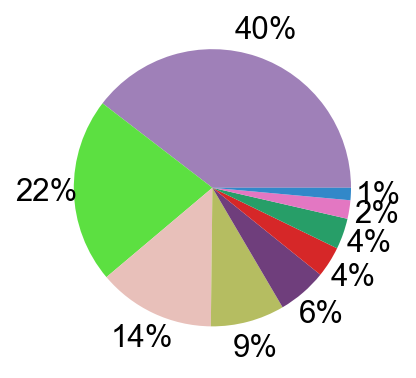
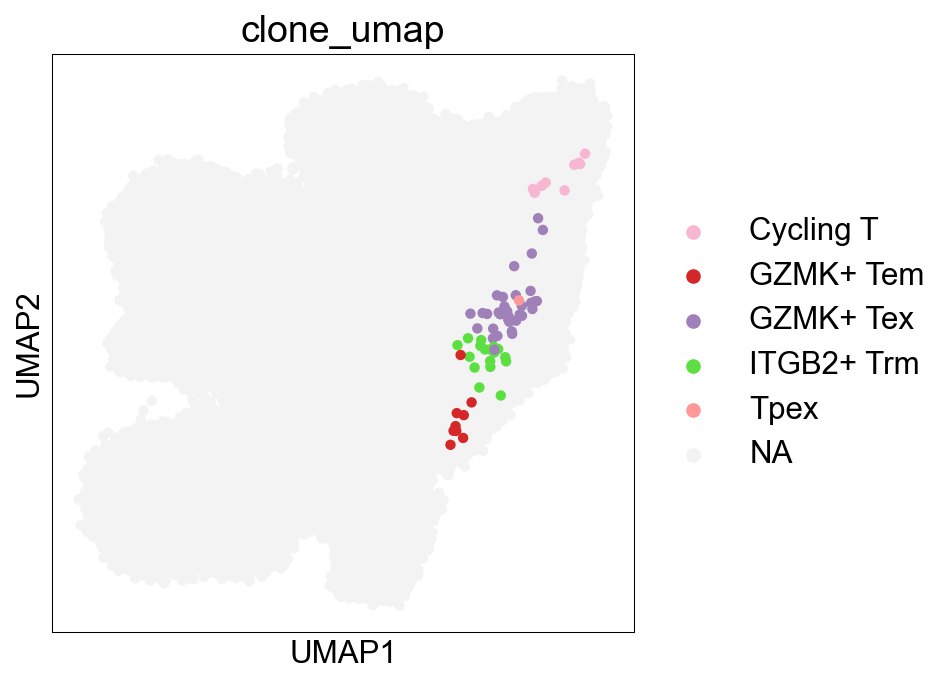
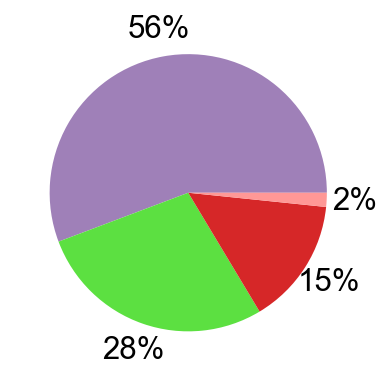
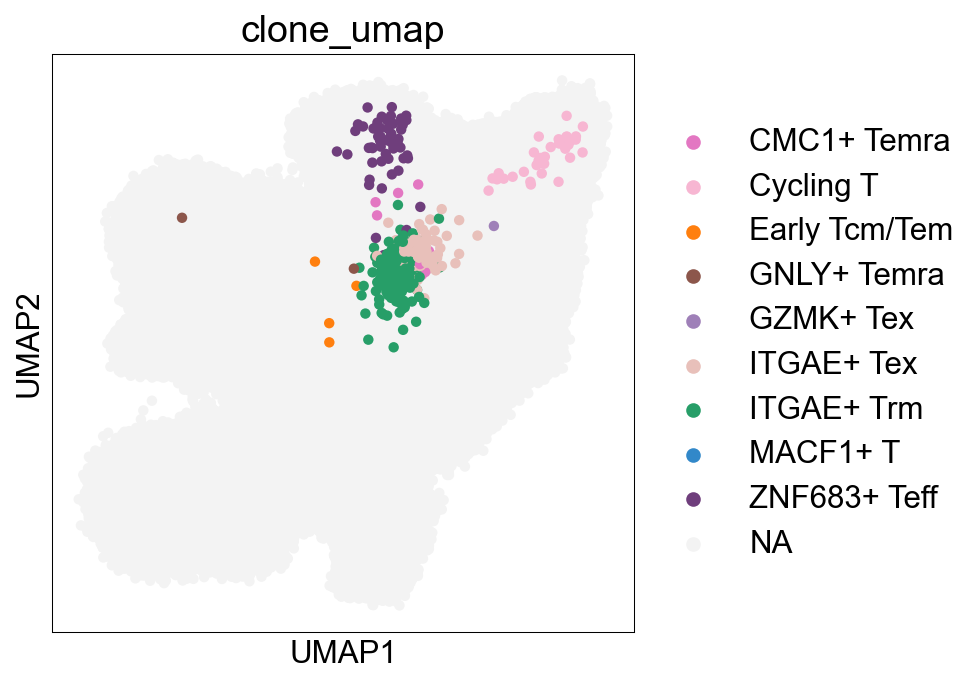
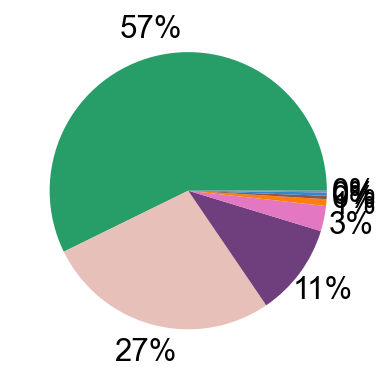
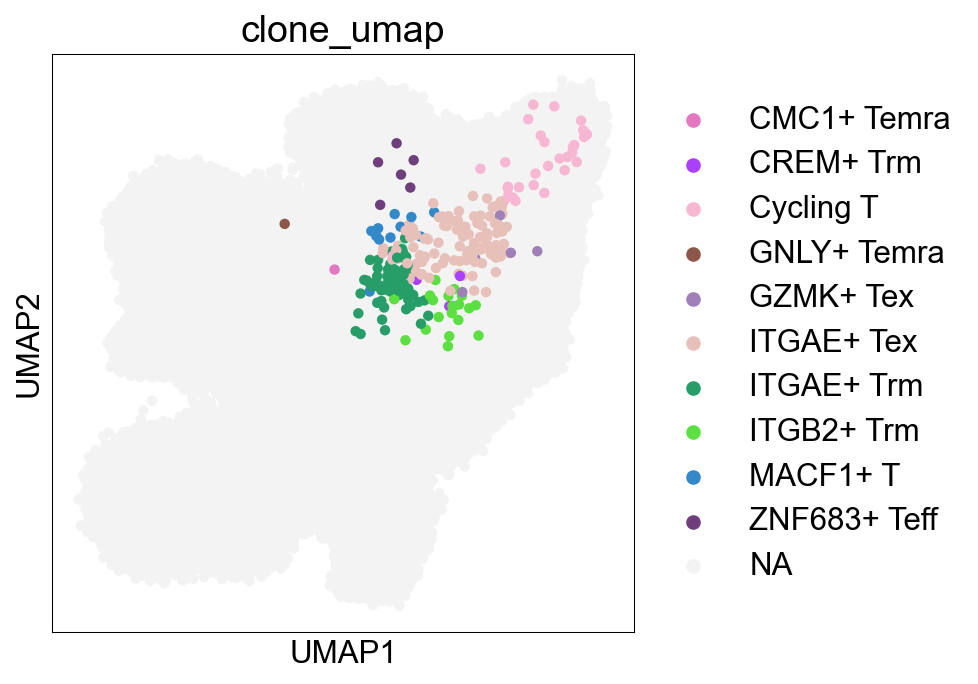
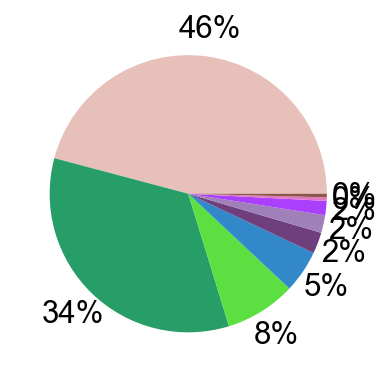
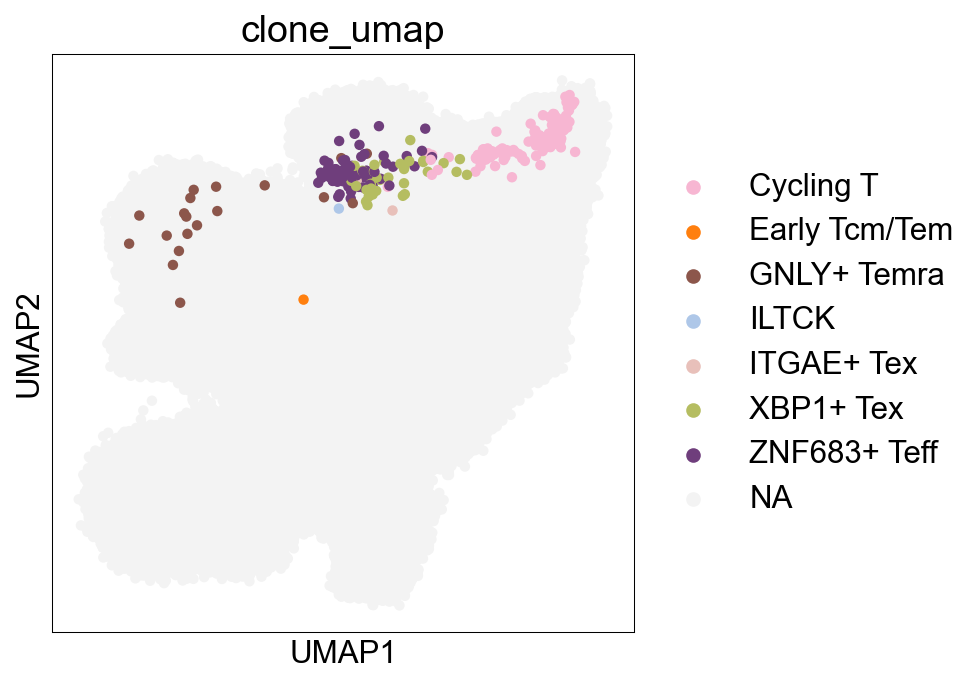
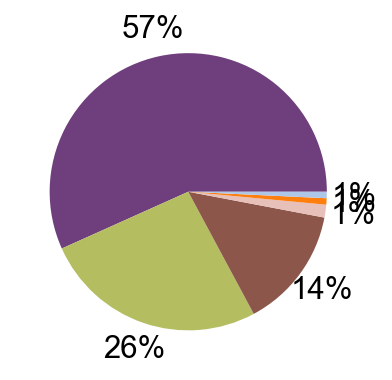
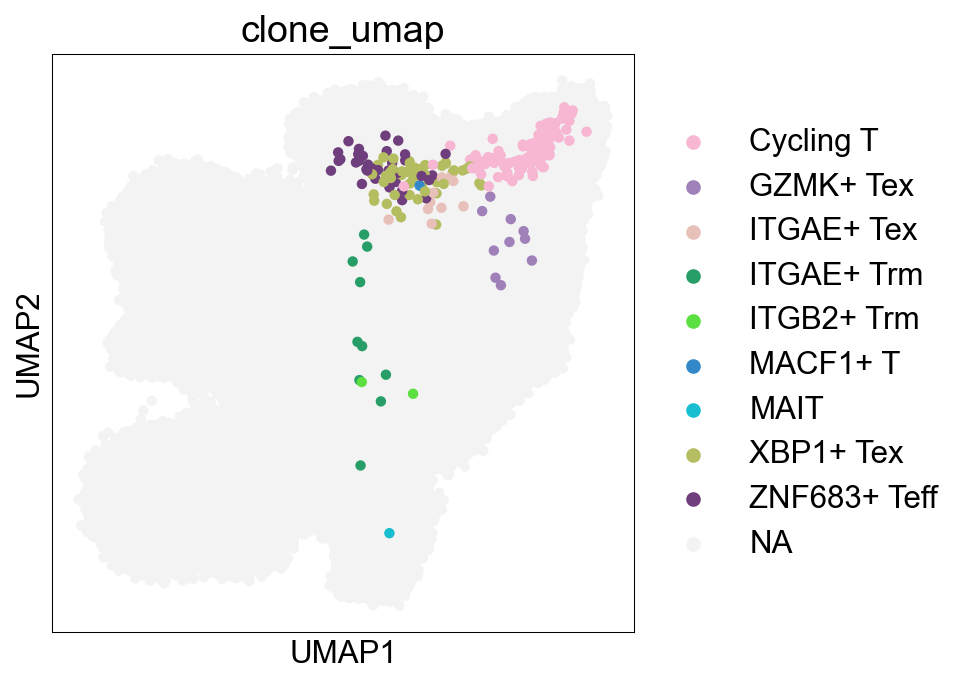
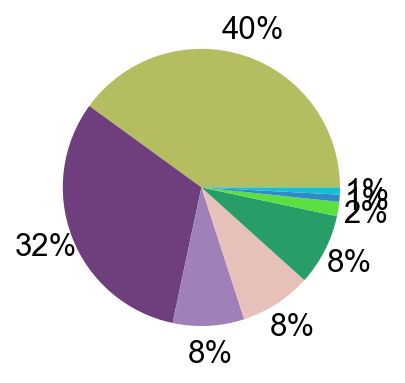
SupFigure9
Extended Data Figure 9A
sc.pl.umap(adata_nogex, color='CXCL13', cmap='Reds', size=5)
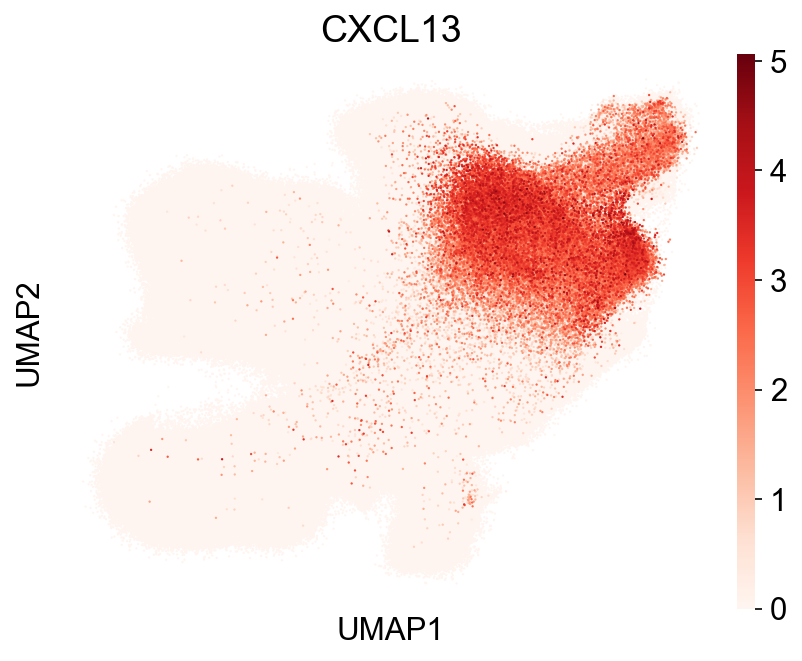
adata_ex = adata_ex[adata_ex.obs['disease']!='Organoid']
adata_ex.obs['disease_type'] = adata_ex.obs['disease_type'].cat.reorder_categories(disease_types)
adata_ex_nmal = adata_ex[adata_ex.obs['meta_cell_subset']=='normal_CD8']
fig,ax = plt.subplots(figsize=(5,5))
sc.pl.violin(adata_ex_nmal, keys='CXCL13', stripplot=False,
             groupby='disease_type', rotation=45, ax=ax)
fig.savefig('figures/CXCL13_disease.pdf')
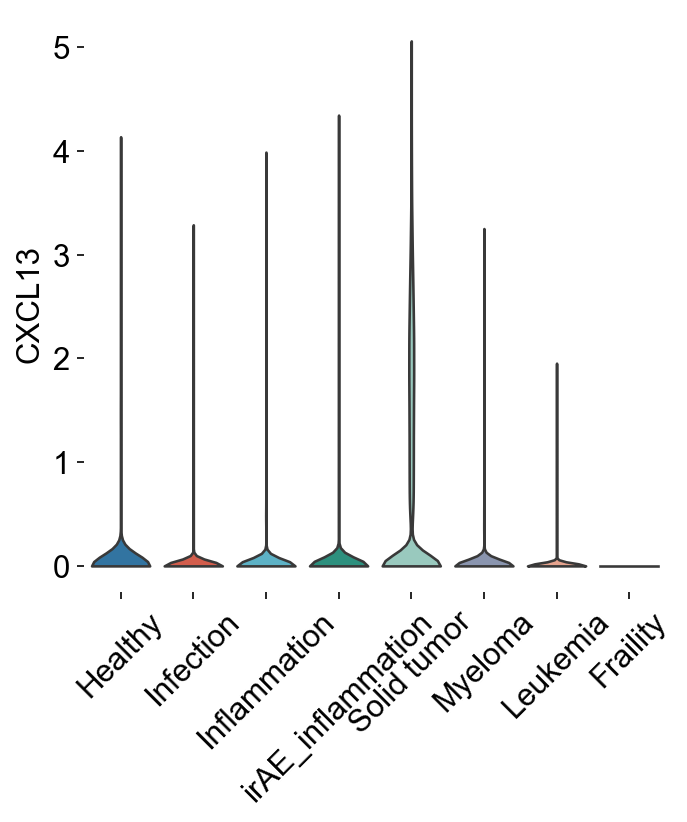
Extended Data Figure 9B-C
adata_nmal = adata_nogex[adata_nogex.obs['meta_cell_subset']=='normal_CD8']
adata_nmal_stumor = adata_nmal[adata_nmal.obs['disease_type']=='Solid tumor']
# adata_nmal_stumor_TIL = adata_nmal_stumor[adata_nmal_stumor.obs['meta_tissue_type_aggr']=='TIL']
obs = adata_nmal_stumor.obs
obs = obs[list(map(lambda x: 'Tex' in x, obs['cell_subtype_3']))]
# obs = obs[obs['study_name'].isin(list(map(lambda z: z[0], filter(lambda x: x[1] > 10, Counter(obs['study_name']).items()))))]
# obs = obs[obs['sample_name'].isin(list(map(lambda z: z[0], filter(lambda x: x[1] > 10, Counter(obs['sample_name']).items()))))]
sample_information = pd.read_csv("/Users/snow/Desktop/sample_information.csv", index_col=0)
obs['disease_type'] = list(sample_information.loc[obs['sample_name'],'Disease'])
obs['disease_type'] = obs['disease_type'].replace("Melanoma",'Skin cancer').replace("Basal cell carinoma tumor","Skin cancer").replace("Squamous cell carcinoma tumor","Skin cancer")
obs = obs[~(np.array(obs['individual_id'] == 'su010') & np.array(obs['disease_type'] == 'Basal cell carinoma tumor'))]
obs['disease_meta_type'] = list(sample_information.loc[obs['sample_name'],'Disease Metatype'])

# the order of disease
factors = {
 'Breast cancer': 6.0,
 'Cholangiocarcinoma': 7.0,
 'Clear cell renal cell carcinoma': 10.0,
 'Esophagus squamous cell carcinoma': 2.0,
 'Gastric Cancer': 5.0,
 'NSCLC': 4.0,
 'Nasopharyngeal carcinoma': 9.0,
 'Pancreatic Cancer': 1.0,
 'Prostate Cancer': 8.0,
 'Skin cancer': 3.0
}

obs = obs[obs['disease_meta_type'] == 'Solid tumor']
obs = obs[obs['disease_type'] != 'BEAM-T']
B = pd.DataFrame(
       list(obs[list(map(lambda x: type(x) == str, obs['cell_subtype_3']))].groupby('disease_type').agg(
           {'cell_subtype_3':lambda x: dict(Counter(x))
           }).iloc[:,0])).fillna(0)

B.insert(0,'disease_type',pd.Categorical(obs['disease_type']).categories)
B['factors'] = list(map(factors.get, B['disease_type']))
B = B.sort_values("factors")
B = B.iloc[:,:-1]
B
B.plot(x='disease_type', kind='bar', stacked=True, color=subtype_color)
<Axes: xlabel='disease_type'>
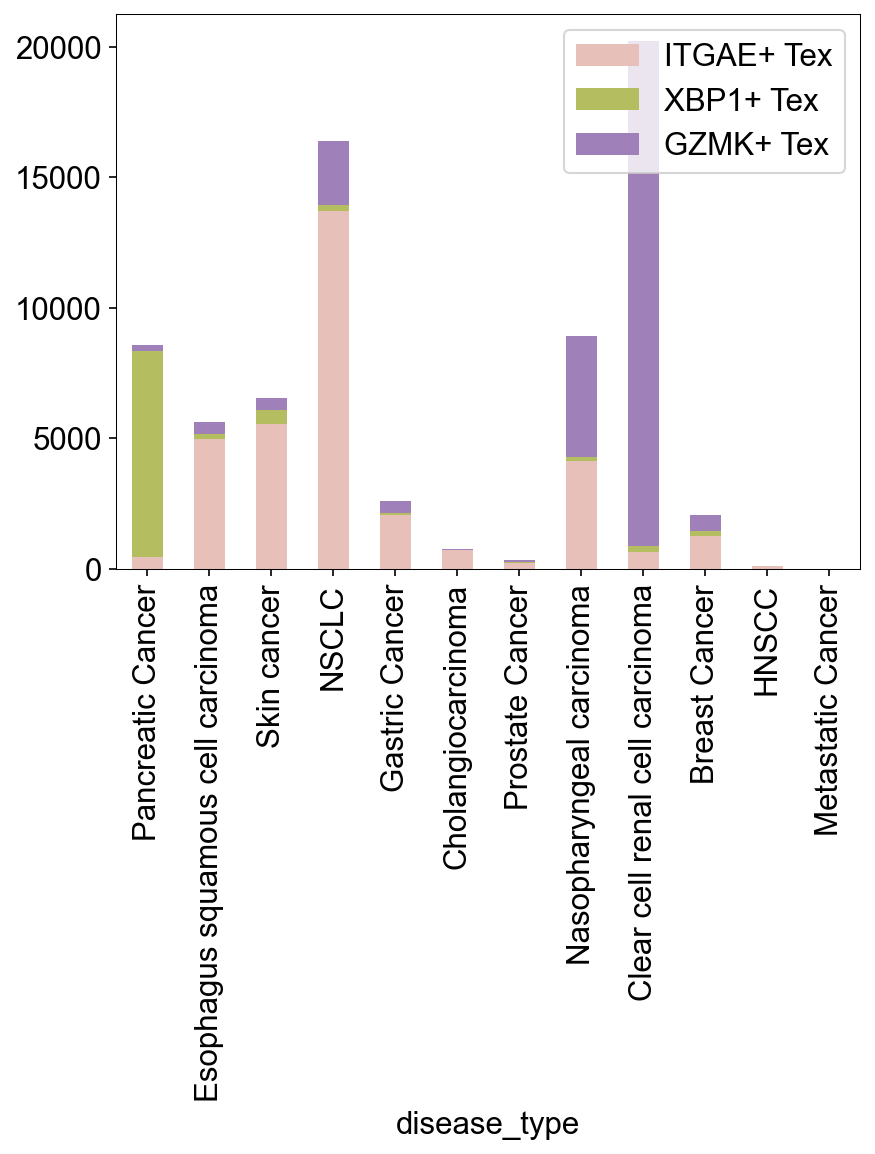
from matplotlib.patches import PathPatch
sample_information = pd.read_csv("/Users/snow/Desktop/sample_information.csv", index_col=0)
adata_nmal_stumor = sc.read_h5ad("/Volumes/rsch/GEXnotebook/source/adata_nmal_stumor_TIL.h5ad")

obs = adata_nmal_stumor.obs
obs['individual'] = list(sample_information.loc[obs['sample_name'], 'Individual ID'])
obs['disease_type'] = obs['disease']
obs['disease_type'] = obs['disease_type'].replace("Melanoma",'Skin cancer').replace("Basal cell carinoma tumor","Skin cancer").replace("Squamous cell carcinoma tumor","Skin cancer")
obs = obs[~(np.array(obs['individual'] == 'su010') & np.array(obs['disease_type'] == 'Basal cell carinoma tumor'))]
obs['individual'] = list(sample_information.loc[obs['sample_name'],'Individual ID'])
# obs = obs[obs['study_name'].isin(list(map(lambda z: z[0], filter(lambda x: x[1] > 10, Counter(obs['study_name']).items()))))]
obs = obs[obs['individual'].isin(list(map(lambda z: z[0], filter(lambda x: x[1] > 100, Counter(obs['individual']).items()))))]

factors2 = {
    'ITGAE+ Tex': 1,
    'GZMK+ Tex': 0,
    'XBP1+ Tex': 2
}
obs = obs[obs['cell_subtype_3'].isin(factors2.keys())]

sample_information = pd.read_csv("/Users/snow/Desktop/sample_information.csv", index_col=0)

obs['disease_meta_type'] = list(sample_information.loc[obs['sample_name'],'Disease Metatype'])
sample_information = pd.read_csv("/Users/snow/Desktop/sample_information.csv", index_col=0)

obs = obs[obs['disease_meta_type'] == 'Solid tumor']
c = Counter(obs['individual'])
agg = obs.groupby(['disease_type','individual',"cell_subtype_3"]).agg({'individual': lambda x: len(x) / c[list(x)[0]]})


agg.columns=['count']
agg = pandas_aggregation_to_wide(agg[~agg.iloc[:,0].isna()])
agg = agg[agg['cell_subtype_3'].isin(factors2.keys())]

#s = set(list(map(lambda x: x[0], list(filter(lambda x: x[1] >= 3*3, Counter(agg['disease_type']).items())))))
#agg = agg[list(map(lambda x: x in s, agg['disease_type']))]


_d = agg.groupby(["individual",'disease_type']).agg({'cell_subtype_3':lambda x: len(np.unique(x)) == 3})
_d = set(list(map(lambda x: x[0], _d[_d.iloc[:,0]].index)))
agg = agg[list(map(lambda x: x in _d, agg['individual']))]


p = agg.pivot_table(values='count',index='disease_type',columns='cell_subtype_3').fillna(0)
factors = {v:k for k,v in enumerate(np.array(p.index)[sns.clustermap(
    p
).dendrogram_row.reordered_ind])}
plt.close()
factors = dict(zip(p.index,(p['GZMK+ Tex'].rank())))


agg['disease_type_key'] = list(map(factors.get, agg['disease_type']))

agg['cell_subtype_3_prediction_key'] = list(map(lambda x: factors2.get(x), agg['cell_subtype_3']))
fig,ax=createFig(figsize=(14,4))

print(Counter(agg['disease_type']))

palette={
        'GZMK+ Tex':'#C5B0D5',
        'GZMK+ Tex DUSP1+': '#2CD500',
        'GZMK+ Tex IL7R+': '#00B4DA',
        'GZMK+ Tex ISG+': '#D5006F',
        'GZMK+ Tex TNFRSF9+': '#9500A3',
        'ITGAE+ Tex':'#E8C0BA',
        'ITGAE+ Tex DUSP1+': '#1A7C00',
        'ITGAE+ Tex IL7R+': '#0065DA',
        'ITGAE+ Tex ISG+': '#D51A00',
        'XBP1+ Tex':'#b5bd61',
    }

sns.boxplot(data=agg.sort_values("cell_subtype_3").sort_values("disease_type_key"), hue='cell_subtype_3', x='disease_type', y='count', showfliers=False, ax=ax, palette=palette)
s1=set(list(map(str,ax.get_children())))
stripplot = sns.stripplot(data=agg.sort_values("cell_subtype_3").sort_values("disease_type_key"), hue='cell_subtype_3', x='disease_type', y='count', dodge=True, palette=palette)
s2=set(list(map(str,ax.get_children())))
s3 = s2.difference(s1)
artists = list(filter(lambda artist:isinstance(artist, matplotlib.collections.PathCollection) and str(artist) in s3, stripplot.get_children()))


for i in range(0,len(artists), 3):
    x1 = artists[i].get_offsets()[:, 0]
    y1 = artists[i].get_offsets()[:, 1]
    x2 = artists[i+1].get_offsets()[:, 0]
    y2 = artists[i+1].get_offsets()[:, 1]
    x3 = artists[i+2].get_offsets()[:, 0]
    y3 = artists[i+2].get_offsets()[:, 1]

    ax.plot([x1,x2],[y1,y2],linestyle='-', marker='', color='#D4D4D4')
    ax.plot([x2,x3],[y2,y3],linestyle='-', marker='', color='#D4D4D4')
    ax.spines['right'].set_visible(False)
    ax.spines['top'].set_visible(False)


adjust_box_widths(fig, 0.6)

plt.xticks(rotation=90)
# plt.savefig("./figures/20240123_tumor_tex_cell_type_composition.pdf")
Counter({'Skin cancer': 39, 'Clear cell renal cell carcinoma': 30, 'Nasopharyngeal carcinoma': 30, 'Breast cancer': 27, 'Gastric Cancer': 24, 'Esophagus squamous cell carcinoma': 21, 'Pancreatic Cancer': 18, 'NSCLC': 15, 'Prostate Cancer': 15, 'Cholangiocarcinoma': 6})
([0, 1, 2, 3, 4, 5, 6, 7, 8, 9],
 [Text(0, 0, 'Pancreatic Cancer'),
  Text(1, 0, 'Esophagus squamous cell carcinoma'),
  Text(2, 0, 'Skin cancer'),
  Text(3, 0, 'NSCLC'),
  Text(4, 0, 'Gastric Cancer'),
  Text(5, 0, 'Breast cancer'),
  Text(6, 0, 'Cholangiocarcinoma'),
  Text(7, 0, 'Prostate Cancer'),
  Text(8, 0, 'Nasopharyngeal carcinoma'),
  Text(9, 0, 'Clear cell renal cell carcinoma')])
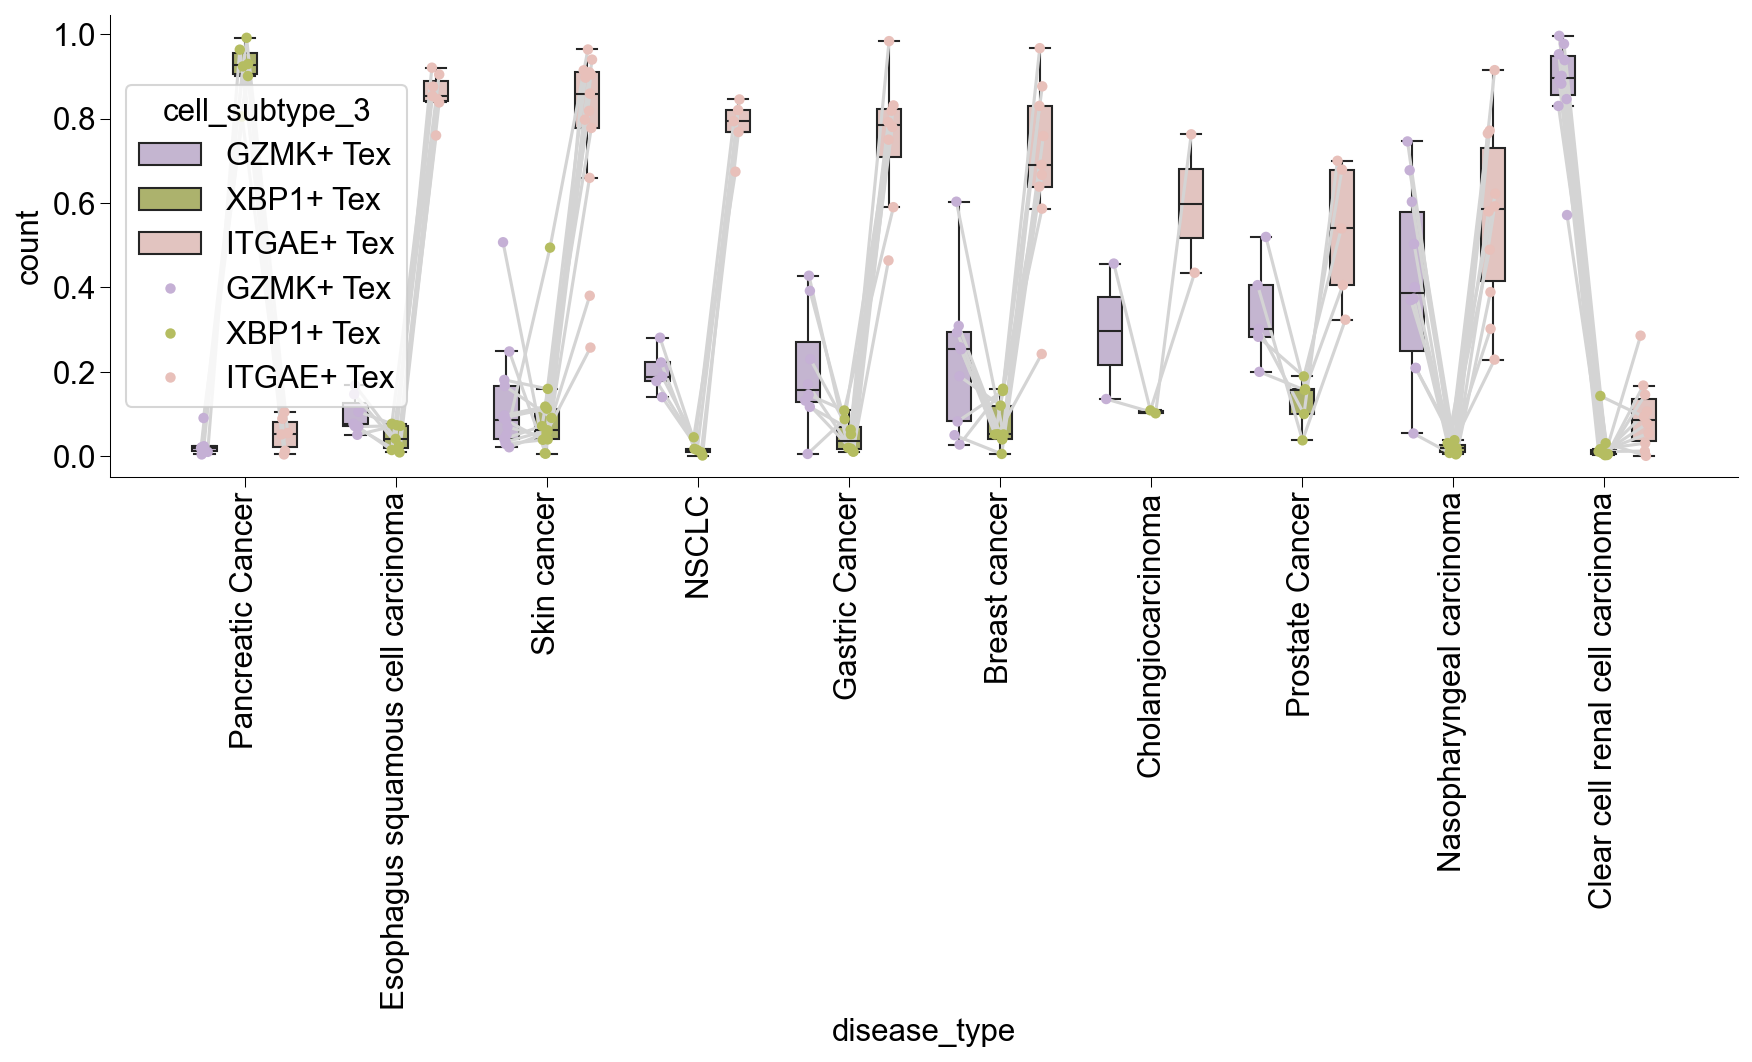
Part3ExpansionInInflam&irAE
CellNumRelated
Functions
circ_color = {
    'Tcm':'#ffbb78',
    'GZMK+ Tem':'#d62728',
    'GNLY+ Temra':'#8c564b',
    'CMC1+ Temra':'#e377c2',
    'Other Subtype':'#f2f2f2',
}
tissue_color = {
    'ITGAE+ Trm':'#279e68',
    'ITGB2+ Trm':'#98df8a',
    'CREM+ Trm':'#aa40fc',
    'GZMK+ Tex':'#c5b0d5',
    'ITGAE+ Tex':'#c49c94',
    'Cycling T':'#f7b6d2',
    'Other Subtype':'#f2f2f2',
}
hiit_color = {
    'Healthy': '#E84C36',
    'Inflammation': '#1DA088',
    'irAE-Inflammation': '#3C5589',
    'Solid tumor': '#F49C7F'}
## Only select healthy sample in the involved study
kid_studies = ['Wang_2021a', 'Ramaswamy_2021']

adata_nokid = adata_nogex[~adata_nogex.obs['study_name'].isin(kid_studies)]
adata_hiit = adata_nokid[
    (
        (adata_nokid.obs['meta_cell_subset']=='normal_CD8') &
        ~(adata_nokid.obs['sample_name'].isin(young_sname+old_sname))
    ) &
    ((
        (adata_nokid.obs['disease_type'].str.contains('Healthy'))
    ) |
    (
        adata_nokid.obs['disease_type'].str.contains('Inflammation')

    ) |
    (
        adata_nokid.obs['disease_type'].str.contains('irAE_inflammation')
    ) |
    (
        (adata_nokid.obs['disease_type']=='Solid tumor') &
        (adata_nokid.obs['meta_tissue_type_aggr']!='Tissue') &
        (adata_nokid.obs['treatment_status'].str.contains('Treatment-naive'))
    ))
] ## data for comparison

## filter cell number too low
hiit_id = [x for x,y in Counter(adata_hiit.obs.individual_id).items() if y>100]
adata_hiit = adata_hiit[adata_hiit.obs['individual_id'].isin(hiit_id)]

## Healthy sample
adata_hiit.obs['disease'] = adata_hiit.obs['disease'].astype('str')
adata_hiit.obs.loc[adata_hiit.obs['disease_type']=='Healthy', 'disease'] = 'Healthy'

adata_hiit.obs['disease'] = adata_hiit.obs['disease'].astype('category')
adata_hiit.obs['disease_type'] = adata_hiit.obs['disease_type'].astype('category')

## Subset adata, filter sample with too few cells
adata_hiit_circ = adata_hiit[
    adata_hiit.obs['meta_tissue_type_aggr']=='Circulating'
]
hiit_circ_id = [x for x,y in Counter(adata_hiit_circ.obs.individual_id).items() if y>100]
adata_hiit_circ = adata_hiit_circ[adata_hiit_circ.obs['individual_id'].isin(hiit_circ_id)]

adata_hiit_tissue_pre = adata_hiit[
    (adata_hiit.obs['meta_tissue_type_aggr']=='Tissue') |
    (adata_hiit.obs['meta_tissue_type_aggr']=='TIL')
]

hiit_tissue_id = [x for x,y in Counter(adata_hiit_tissue_pre.obs.individual_id).items() if y>100]
adata_hiit_tissue_pre = adata_hiit_tissue_pre[adata_hiit_tissue_pre.obs['individual_id'].isin(hiit_tissue_id)]

## subset colon/arthritis tissue
adata_hiit_tissue_arth = adata_hiit_tissue_pre[
    (adata_hiit_tissue_pre.obs['study_name'].str.contains('Boland')) |
    (adata_hiit_tissue_pre.obs['study_name'].str.contains('Corridoni')) |
    (adata_hiit_tissue_pre.obs['study_name'].str.contains('Luoma')) |
    (adata_hiit_tissue_pre.obs['disease']=='Ulcerative colitis') |
    (adata_hiit_tissue_pre.obs['disease']=='CPI-colitis') |
    (adata_hiit_tissue_pre.obs['disease']=='Arthritis') |
    (adata_hiit_tissue_pre.obs['disease_type']=='Solid tumor')
]
adata_hiit_tissue = adata_hiit_tissue_arth[adata_hiit_tissue_arth.obs['disease']!='Arthritis']

## solid tumor
adata_hiit_stumor_circ = adata_hiit_circ[
    adata_hiit_circ.obs['disease_type']=='Solid tumor'
]
adata_hiit_stumor_til = adata_hiit_tissue[
    adata_hiit_tissue.obs['disease_type']=='Solid tumor'
]
def cell_ratio(adata=adata_nogex,
               groupby='disease_type',
               groups=['Healthy', 'Inflammation',
                       'irAE_inflammation', 'Solid tumor'],
               subtypeby='cell_subtype_3',
               subtypes=cell_subtypes,
               expanded=True, total=False):

    df = pd.DataFrame([])
    for i in groups:
        adata_grouped = adata[adata.obs[groupby]==i]
        if expanded == True:
            adata_grouped_test = adata_grouped[
                (adata_grouped.obs['cc_aa_identity_size']>=3)
            ]
        elif expanded == False:
            adata_grouped_test = adata_grouped
        else:
            adata_grouped_test = adata_grouped[
                (adata_grouped.obs['cc_aa_identity_size']>=expanded)
            ]


        df0 = pd.DataFrame([])
        if total == True:
            a = pd.Series(Counter(adata_grouped_test.obs.individual_id))
            b = pd.Series(Counter(adata_grouped.obs.individual_id))
            c = pd.concat([a,b],axis=1)
            c[0] = c[0].fillna(0)

            x = pd.DataFrame({"ratio":c[0]/c[1]})
            x['subtypes'] = 'Total'
            df0 = pd.concat([df0, x])
        for j in subtypes:
            a = pd.Series(Counter(adata_grouped_test.obs[
                adata_grouped_test.obs[subtypeby]==j
            ].individual_id))
            b = pd.Series(Counter(adata_grouped.obs.individual_id))
            c = pd.concat([a,b],axis=1)
            c[0] = c[0].fillna(0)

            x = pd.DataFrame({"ratio":c[0]/c[1]})
            x['subtypes'] = list(np.repeat(j, len(x)))
            df0 = pd.concat([df0, x])

        df0['disease_types'] = list(np.repeat(i, len(df0)))
        df = pd.concat([df, df0])

    return df
## multi boxplot
from matplotlib.patches import PathPatch
def adjust_box_widths(axes, fac):
    """
    Adjust the withs of a seaborn-generated boxplot.
    """
    for ax in axes:
        ## iterating through axes artists:
        for c in ax.get_children():

            ## searching for PathPatches
            if isinstance(c, PathPatch):
                ## getting current width of box:
                p = c.get_path()
                verts = p.vertices
                verts_sub = verts[:-1]
                xmin = np.min(verts_sub[:, 0])
                xmax = np.max(verts_sub[:, 0])
                xmid = 0.5*(xmin+xmax)
                xhalf = 0.5*(xmax - xmin)

                ## setting new width of box
                xmin_new = xmid-fac*xhalf
                xmax_new = xmid+fac*xhalf
                verts_sub[verts_sub[:, 0] == xmin, 0] = xmin_new
                verts_sub[verts_sub[:, 0] == xmax, 0] = xmax_new

                ## setting new width of median line
                for l in ax.lines:
                    if np.all(l.get_xdata() == [xmin, xmax]):
                        l.set_xdata([xmin_new, xmax_new])

def sep_multi_boxplot(multi_box, file_name, palette_list=disease_type_color.values(),
                      xaxis='variable', yaxis='value', hueaxis='origin'):
    matplotlib.rcParams['axes.linewidth'] = 0.5
    fig,ax = plt.subplots(1,len(np.unique(multi_box[xaxis])),figsize=(12,8))


    ## add padding between the subplots
    plt.subplots_adjust(wspace=0.7)

    for idx,i in enumerate(multi_box[xaxis].unique()):
        grouped_box = multi_box[multi_box[xaxis]==i]
        grouped_box[xaxis] = grouped_box[xaxis].astype('str')
        ## draw boxplot for age in the 1st subplot
        sns.boxplot(data=grouped_box,
                    x=xaxis, y=yaxis, hue=hueaxis, palette=palette_list,
                    linewidth=0.5, boxprops={"zorder":2},
                    showfliers=False, ax=ax[idx])
        ax[idx].set_xlabel(i)
        ## Extract x and y coordinates of the dots
        sns.stripplot(x=xaxis, y=yaxis, hue=hueaxis,
                      linewidth=0.5, edgecolor='black',
                      palette=palette_list,
                      dodge=True, data=grouped_box, ax=ax[idx])

        ax[idx].spines['right'].set_visible(False)
        ax[idx].spines['top'].set_visible(False)
        ax[idx].legend().set_visible(False)

    plt.legend(bbox_to_anchor=(1.3, 0.5), loc='center right')
    fig.autofmt_xdate(rotation=45)

    adjust_box_widths(ax, 0.75)
    fig.savefig(file_name)
    plt.show()
Circulating
Counter(adata_hiit_circ.obs['disease_type'])
Counter({'Healthy': 58954,
         'Solid tumor': 47339,
         'Inflammation': 24129,
         'irAE_inflammation': 12021})
target_cells = 12021
cluster_key = 'disease_type'
adata = adata_hiit_circ

adatas = [adata[adata.obs[cluster_key]==clust] for clust in np.unique(adata.obs[cluster_key])]

for dat in adatas:
    if dat.n_obs > target_cells:
         sc.pp.subsample(dat, n_obs=target_cells)

adata_downsampled = adatas[0].concatenate(*adatas[1:])
adata_downsampled.obs.index = [ '-'.join(i.split('-')[:-1]) for i in adata_downsampled.obs.index ]
## MainFigure3A, stats
adata_nogex.obs['expanded_distribution'] = None
adata_nogex.obs.loc[
    adata_downsampled.obs[
        (
            (adata_downsampled.obs['cell_subtype_3'].str.contains('Tem')) |
            (adata_downsampled.obs['cell_subtype_3'].str.contains('Tcm')) |
            (adata_downsampled.obs['cell_subtype_3'].str.contains('Cycling'))
        ) &
        (
            (adata_downsampled.obs['cc_aa_identity_size']>=3)
        )
    ].index, 'expanded_distribution'
] = adata_downsampled.obs['disease_type']
## MainFigure3A
fig,ax = plt.subplots(figsize=(10,8))
sc.pl.umap(adata_nogex, color='expanded_distribution', size=15,
           na_color='#f7f7f7', palette=disease_type_color, ax=ax)
fig.savefig('figures/G_expanded_circ_cells.png', dpi=600)
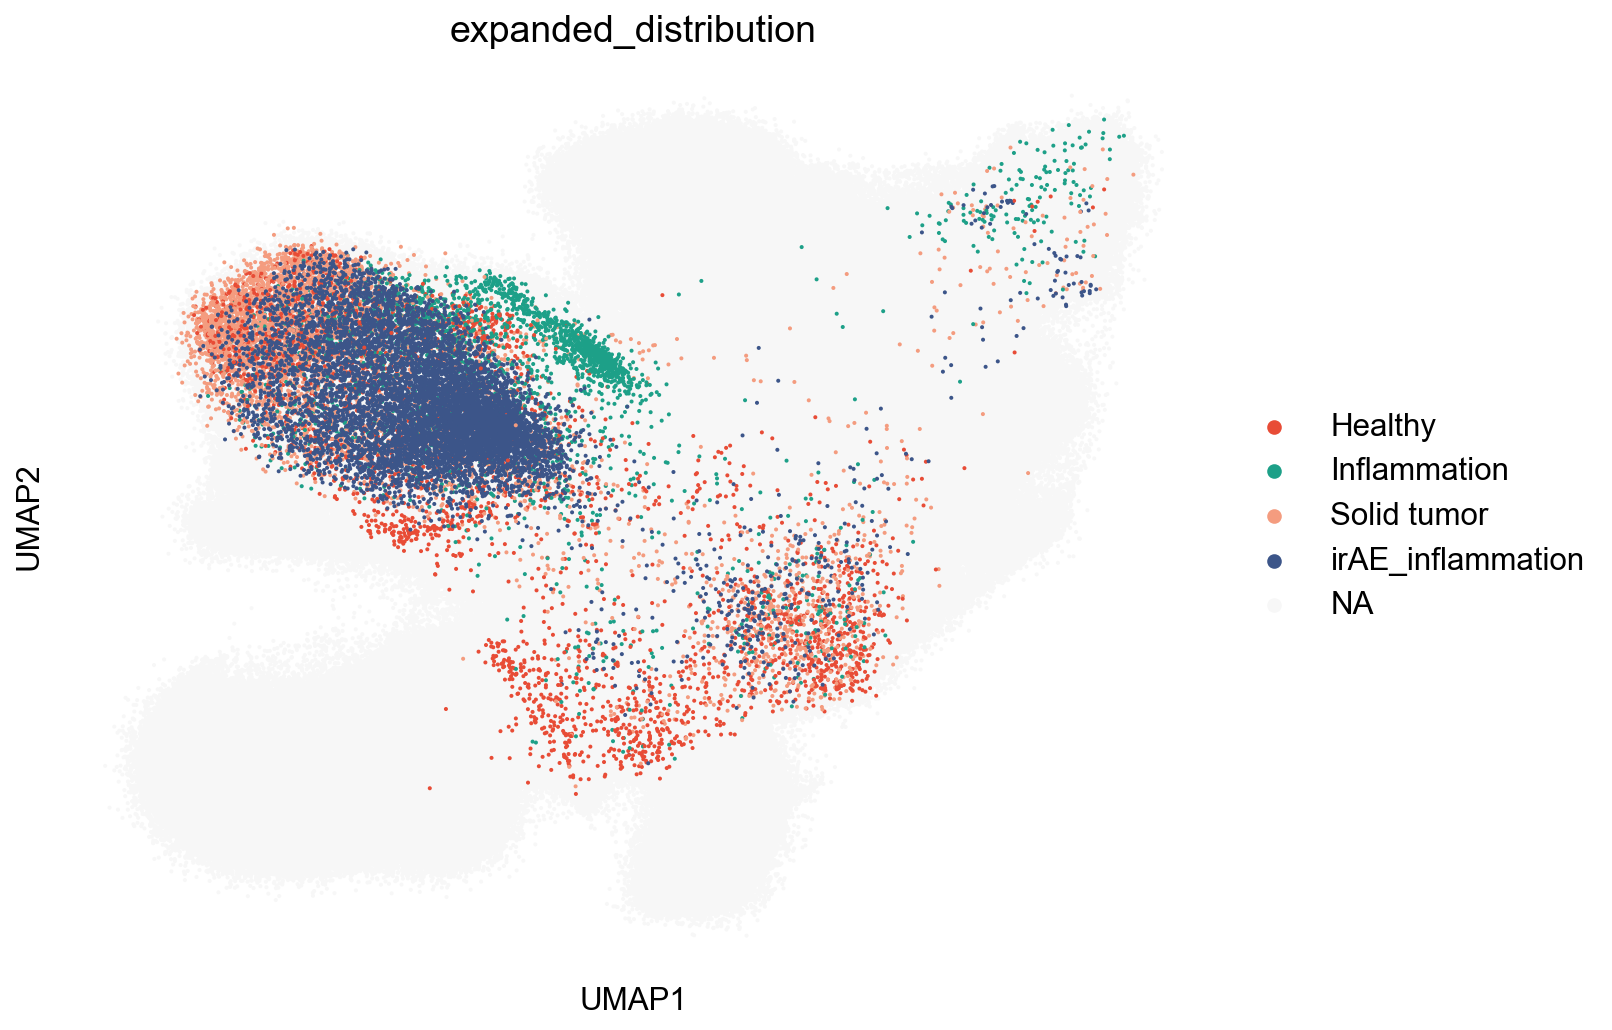
Counter(adata_hiit_stumor_circ.obs['disease'])
Counter({'Melanoma': 3614,
         'Cholangiocarcinoma': 2896,
         'Gallbladder carcinoma': 3105,
         'Human thymic epithelial tumors (TET)': 4484,
         'Gastric Cancer': 2972,
         'Ovarian Cancer': 1237,
         'Breast cancer': 6885,
         'Nasopharyngeal carcinoma': 21116,
         'Clear cell renal cell carcinoma': 1030})
## SupFigures
circ_subtypes_aggr=['Tcm/Tem', 'GNLY+ Temra', 'CMC1+ Temra']
disease_types_compare = ['Healthy', 'Inflammation', 'irAE_inflammation', 'Solid tumor']
adata_hiit_circ.obs['cell_subtype_comparison'] = adata_hiit_circ.obs['meta_cell_subtype'].copy()
adata_hiit_circ.obs['cell_subtype_comparison'] = adata_hiit_circ.obs['cell_subtype_comparison'].astype('str')
adata_hiit_circ.obs.loc[
    adata_hiit_circ.obs['cell_subtype_3']=='GNLY+ Temra', 'cell_subtype_comparison'
]='GNLY+ Temra'
adata_hiit_circ.obs.loc[
    adata_hiit_circ.obs['cell_subtype_3']=='CMC1+ Temra', 'cell_subtype_comparison'
]='CMC1+ Temra'
disease_circ_ratio = cell_ratio(adata=adata_hiit_circ,
                                groupby='disease_type',
                                groups=disease_types_compare,
                                subtypeby='cell_subtype_comparison',
                                subtypes=circ_subtypes_aggr, expanded=True, total=True)
sep_multi_boxplot(disease_circ_ratio,
                  xaxis='subtypes', yaxis='ratio', hueaxis='disease_types',
                  palette_list=hiit_color.values(),
                  file_name='figures/F4h_circ_ratio.pdf')
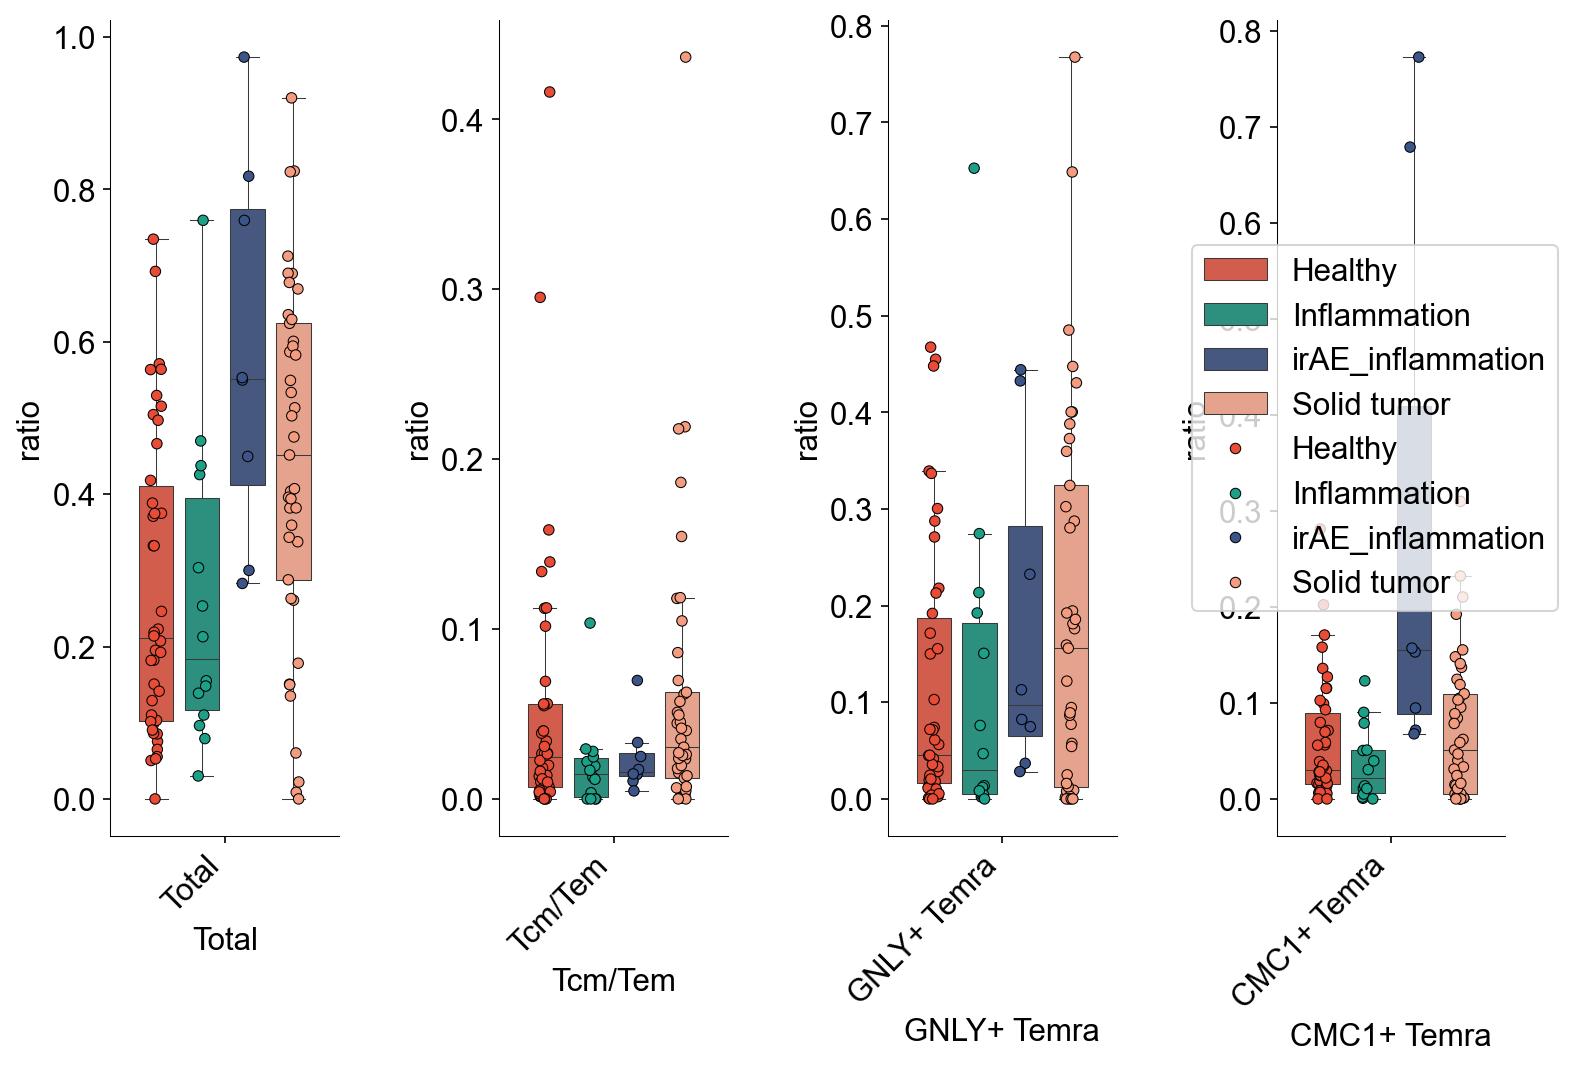
Counter(disease_circ_ratio[(disease_circ_ratio['subtypes']=='Tcm/Tem')]['disease_types'])
Counter({'Healthy': 42,
         'Inflammation': 14,
         'irAE_inflammation': 8,
         'Solid tumor': 41})
scipy.stats.mannwhitneyu(disease_circ_ratio[
    (disease_circ_ratio['subtypes']=='CMC1+ Temra')&
    (disease_circ_ratio['disease_types']=='irAE_inflammation')].ratio,
                  disease_circ_ratio[
    (disease_circ_ratio['subtypes']=='CMC1+ Temra')&
    (disease_circ_ratio['disease_types']=='Solid tumor')].ratio)
MannwhitneyuResult(statistic=269.0, pvalue=0.004691950871805162)
## Expansion Pie Charts
circ_healthy_expansion_pie = tissue_pie_data(
    adata_use=adata_hiit_circ,
    groupby='disease_type', groupby_type='Healthy',
    ratioby='expansion_size', ratioby_type=['1', '2'],
    expanded=False)
circ_inflam_expansion_pie = tissue_pie_data(
    adata_use=adata_hiit_circ,
    groupby='disease_type', groupby_type='Inflammation',
    ratioby='expansion_size', ratioby_type=['1', '2'],
    expanded=False)
circ_irae_expansion_pie = tissue_pie_data(
    adata_use=adata_hiit_circ,
    groupby='disease_type', groupby_type='irAE_inflammation',
    ratioby='expansion_size', ratioby_type=['1', '2'],
    expanded=False)
circ_stumor_expansion_pie = tissue_pie_data(
    adata_use=adata_hiit_circ,
    groupby='disease_type', groupby_type='Solid tumor',
    ratioby='expansion_size', ratioby_type=['1', '2'],
    expanded=False)

expansion_size_color = ['#d4dced','#87a8d7','#39547d',]
fig,ax = plt.subplots(1,4)
ax[0].pie(circ_healthy_expansion_pie[0], radius=1, colors=expansion_size_color,
       autopct='%1.0f%%', pctdistance=1.2, explode=(0,0,0.1), shadow=True,startangle=90)
ax[1].pie(circ_inflam_expansion_pie[0], radius=1, colors=expansion_size_color,
       autopct='%1.0f%%', pctdistance=1.2, explode=(0,0,0.1), shadow=True,startangle=90)
ax[2].pie(circ_irae_expansion_pie[0], radius=1, colors=expansion_size_color,
       autopct='%1.0f%%', pctdistance=1.2, explode=(0,0,0.1), shadow=True,startangle=90)
ax[3].pie(circ_stumor_expansion_pie[0], radius=1, colors=expansion_size_color,
       autopct='%1.0f%%', pctdistance=1.2, explode=(0,0,0.1), shadow=True,startangle=90)

fig.savefig('figures/NH1_circ_expansion_pie.pdf')
plt.show()
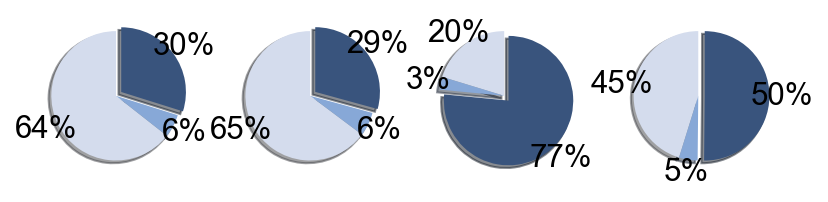
## Disease-subtype Pie Charts
circ_healthy_pie = tissue_pie_data(adata_use=adata_hiit_circ,
    groupby='disease_type', groupby_type='Healthy',
    ratioby='cell_subtype_3', ratioby_type=['Tcm', 'GZMK+ Tem', 'GNLY+ Temra', 'CMC1+ Temra'],
    expanded=True)
circ_inflam_pie = tissue_pie_data(adata_use=adata_hiit_circ,
    groupby='disease_type', groupby_type='Inflammation',
    ratioby='cell_subtype_3', ratioby_type=['Tcm', 'GZMK+ Tem', 'GNLY+ Temra', 'CMC1+ Temra'],
    expanded=True)
circ_irae_pie = tissue_pie_data(adata_use=adata_hiit_circ,
    groupby='disease_type', groupby_type='irAE_inflammation',
    ratioby='cell_subtype_3', ratioby_type=['Tcm', 'GZMK+ Tem', 'GNLY+ Temra', 'CMC1+ Temra'],
    expanded=True)
circ_stumor_pie = tissue_pie_data(adata_use=adata_hiit_circ,
    groupby='disease_type', groupby_type='Solid tumor',
    ratioby='cell_subtype_3', ratioby_type=['Tcm', 'GZMK+ Tem', 'GNLY+ Temra', 'CMC1+ Temra'],
    expanded=True)

fig,ax = plt.subplots(1,4)
ax[0].pie(circ_healthy_pie[0], radius=1, colors=circ_color.values(),
       autopct='%1.0f%%', pctdistance=1.2,)
ax[1].pie(circ_inflam_pie[0], radius=1, colors=circ_color.values(),
       autopct='%1.0f%%', pctdistance=1.2,)
ax[2].pie(circ_irae_pie[0], radius=1, colors=circ_color.values(),
       autopct='%1.0f%%', pctdistance=1.2,)
ax[3].pie(circ_stumor_pie[0], radius=1, colors=circ_color.values(),
       autopct='%1.0f%%', pctdistance=1.2,)

fig.savefig('figures/NH2_circ_expansion_pie.pdf')
plt.show()
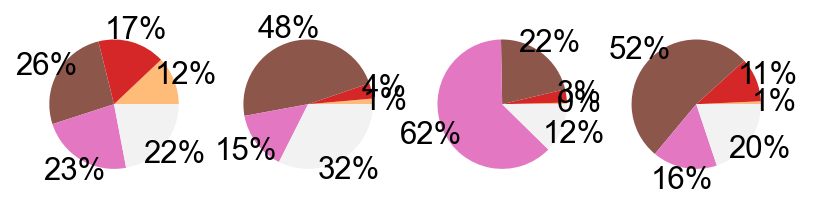
DEGAnalysis
adata_irae_inflam_circ = adata_hiit_circ[adata_hiit_circ.obs['disease_type'].str.contains('nflammation')]
adata_irae_inflam_circ.uns['log1p']['base'] = None
adata_ii_circ_allg = adata_gene[adata_gene.obs.index.isin(adata_irae_inflam_circ.obs.index)]
sc.tl.rank_genes_groups(adata_ii_circ_allg, groupby='cell_subtype_3',
                        groups=['CMC1+ Temra'], reference='GNLY+ Temra')
WARNING: Default of the method has been changed to 't-test' from 't-test_overestim_var'
fig,ax=ScanpyVolcanoPlot(
    adata_ii_circ_allg, axis=0,
    label_fold_change=0.25, label_log_p=2,
    label_size=6 ,
    label_excludes=list(adata_ii_circ_allg.var.index),
    label_includes=[
        'STAT1',
        'IFITM1',
        'ISG15',
        'IFI6',
        'KLRB1',
        'FCGR3A',
        'CD160',
        'KLRD1',
        # control
        'CXCR4',
        'IL7R',
        'NR4A2'
    ],
    color2=subtype_color['CMC1+ Temra'],
    color1=subtype_color['GNLY+ Temra'],
    size_by='cell_subtype_3',
    size_group='CMC1+ Temra',
    size_reference='GNLY+ Temra'
)
fig.set_size_inches((4,4))
fig.savefig('figures/NNE1_noadj_irAE_Temra_volc_up.pdf')
Fraction of gene STAT1 is 0.5216695559407921
Fraction of gene IFITM1 is 0.965062008267769
Fraction of gene ISG15 is 0.4123216428857181
Fraction of gene IFI6 is 0.3132417655687425
Fraction of gene KLRB1 is 0.48699826643552474
Fraction of gene FCGR3A is 0.5278037071609548
Fraction of gene CD160 is 0.3685824776636885
Fraction of gene KLRD1 is 0.8133084411254834
Fraction of gene CXCR4 is 0.5222029603947193
Fraction of gene IL7R is 0.13348446459527938
Fraction of gene NR4A2 is 0.35978130417388987
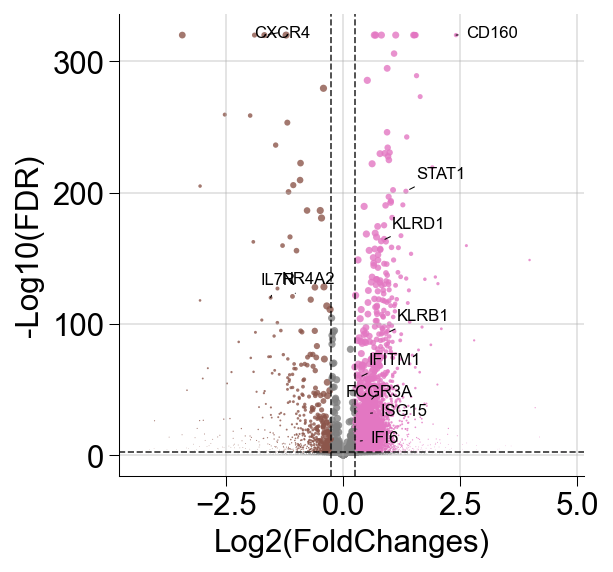
## list contains: deg_tex,deg_tex_up,deg_tex_dw,enr_tex_up,enr_tex_dw
temra_list = DEG_analysis(adata_ii_circ_allg, groupby='cell_subtype_3',
                          query_subtype='CMC1+ Temra',reference_subtype='GNLY+ Temra')
temra_list[3].res2d.Term = temra_list[3].res2d.Term.str.split(" \(GO").str[0]
## dotplot
gseapy.dotplot(temra_list[3].res2d.iloc[[3,8,9,13,17,18,40,68,315],],
               size=20, top_term=10, title='Up',
               cmap=make_colormap(['#f9e1ef','#d83d9d']),
               figsize=(3,10))

plt.savefig('figures/F_irAE_Temra_go_up.pdf')
plt.show()
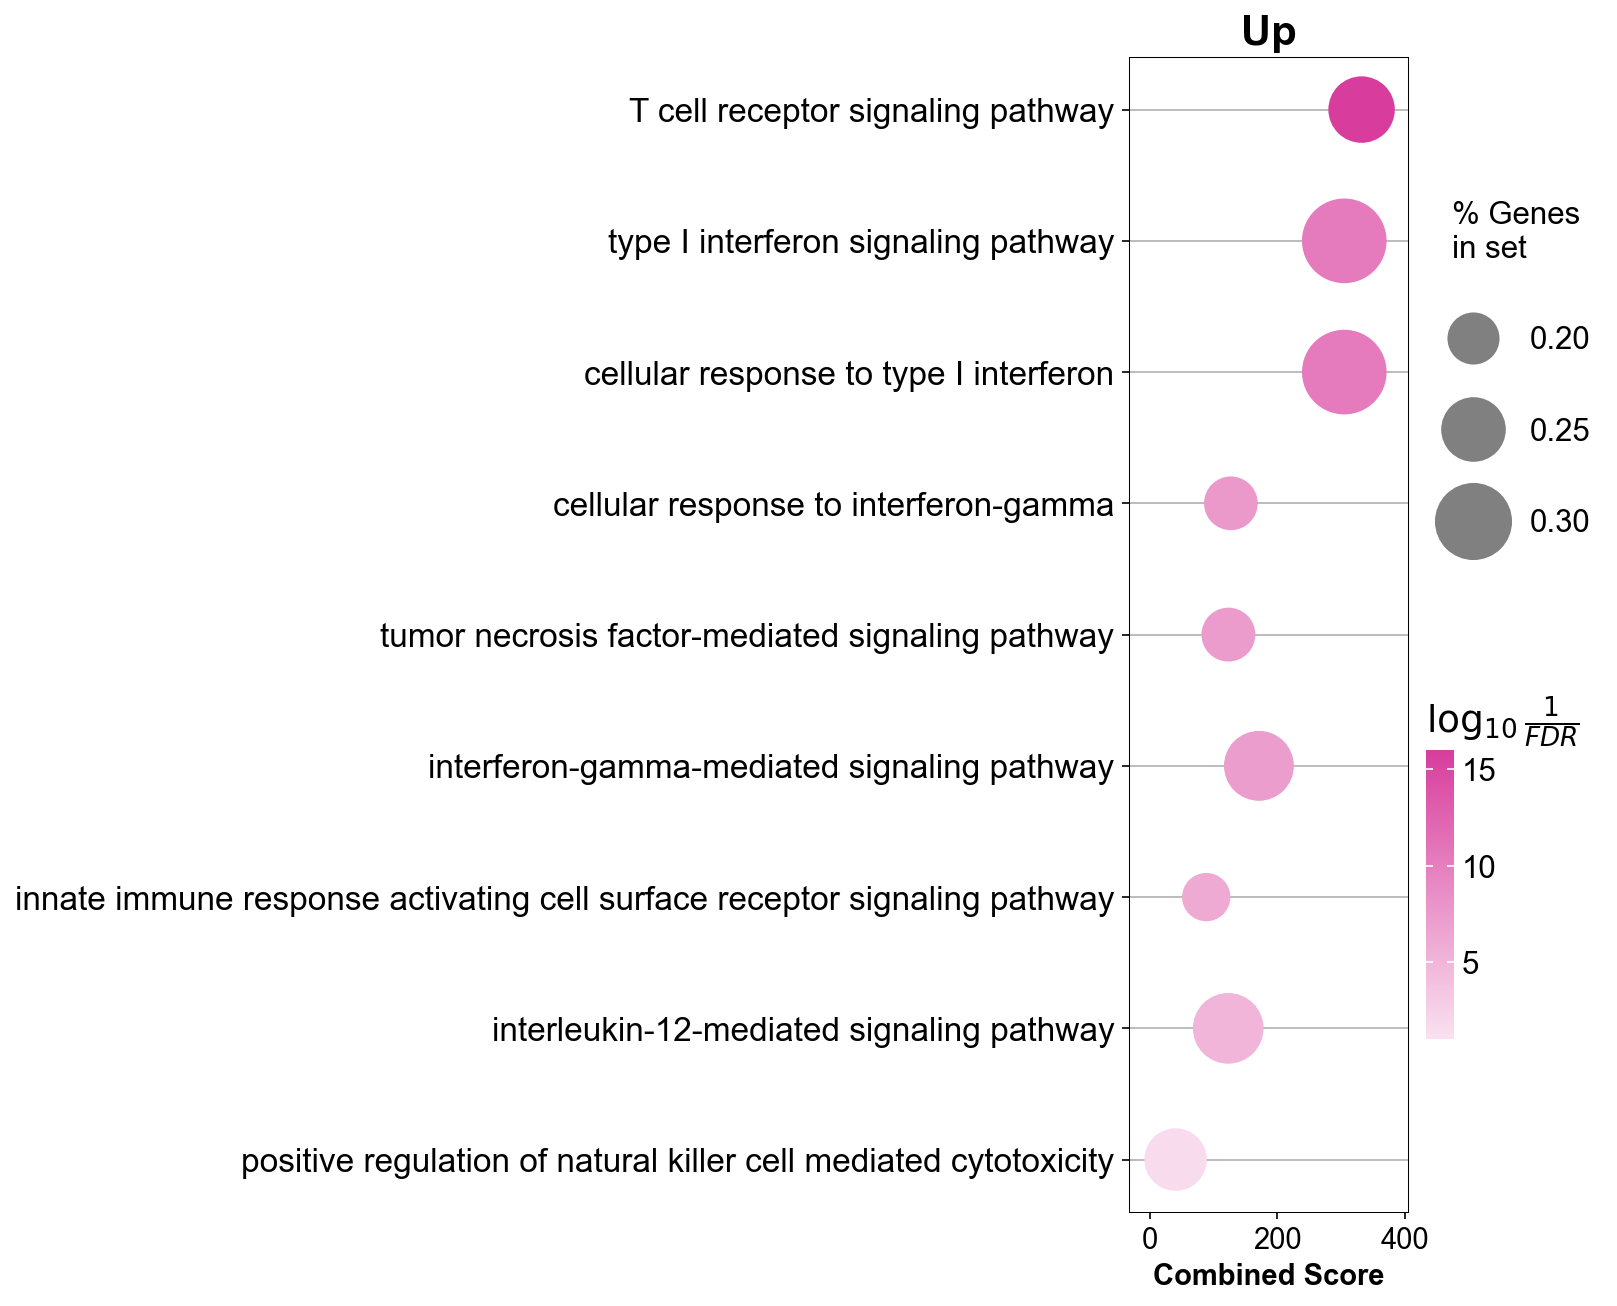
adata = adata_ii_circ_allg
groupby = 'cell_subtype_3'
group_frac_dict = {}

for size_obs_group in np.unique(adata.obs[groupby]):
    _adata = adata[
         adata.obs[groupby] == size_obs_group
    ]
    frac = dict(zip(_adata.var.index, np.array((_adata.X > 0).sum(0) / _adata.shape[0]).flatten()))
    group_frac_dict[size_obs_group] = frac
group_frac_dict['GNLY+ Temra']['CXCR4']
0.7049699799866578
Tissue
Counter(adata_hiit_tissue.obs.disease_type)
Counter({'Solid tumor': 122915,
         'Healthy': 26820,
         'Inflammation': 9527,
         'irAE_inflammation': 11405})
target_cells = 9527
cluster_key = 'disease_type'
adata = adata_hiit_tissue

adatas = [adata[adata.obs[cluster_key]==clust] for clust in np.unique(adata.obs[cluster_key])]

for dat in adatas:
    if dat.n_obs > target_cells:
         sc.pp.subsample(dat, n_obs=target_cells)

adata_downsampled = adatas[0].concatenate(*adatas[1:])
adata_downsampled.obs.index = [ '-'.join(i.split('-')[:-1]) for i in adata_downsampled.obs.index ]
## MainFigure3C, stats
adata_nogex.obs['expanded_distribution'] = None
adata_nogex.obs.loc[
    adata_downsampled.obs[
        (
            (adata_downsampled.obs['cell_subtype_3'].str.contains('Trm')) |
            (adata_downsampled.obs['cell_subtype_3'].str.contains('Tex')) |
            (adata_downsampled.obs['cell_subtype_3'].str.contains('Cycling'))
        ) &
        (
            (adata_downsampled.obs['cc_aa_identity_size']>=3)
        )
    ].index, 'expanded_distribution'
] = adata_downsampled.obs['disease_type']
## SupFigures
fig,ax = plt.subplots(figsize=(10,8))
sc.pl.umap(adata_nogex, color='expanded_distribution', size=20, na_color="#f7f7f7",
           ax=ax, palette=disease_type_color)
fig.savefig('figures/A_tissue_cells.png', dpi=600)
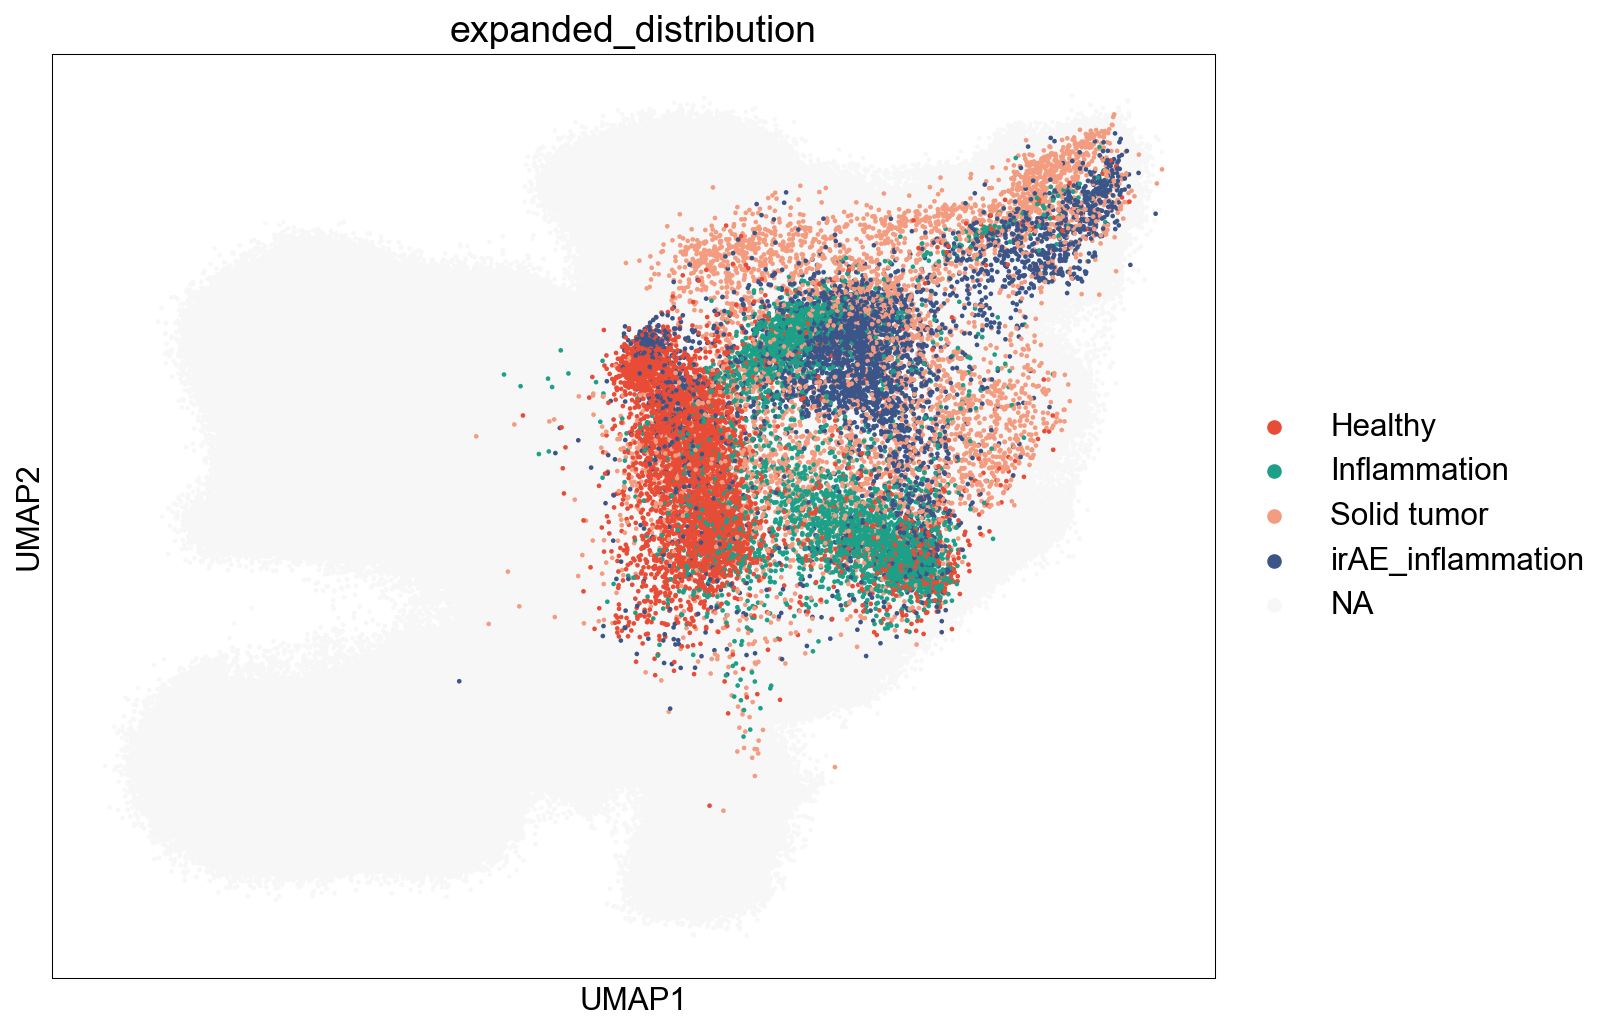
Counter(adata_nogex.obs[adata_nogex.obs['study_name']=='Luoma_2020'].disease)
Counter({'Control (Luoma et al.)': 13958, 'CPI-colitis': 11405})
## Disease-subtype Pie Charts
tissue_healthy_expansion_pie = tissue_pie_data(adata_use=adata_hiit_tissue,
    groupby='disease_type', groupby_type='Healthy',
    ratioby='expansion_size', ratioby_type=['1', '2'],
    expanded=False)
tissue_inflam_expansion_pie = tissue_pie_data(adata_use=adata_hiit_tissue,
    groupby='disease_type', groupby_type='Inflammation',
    ratioby='expansion_size', ratioby_type=['1', '2'],
    expanded=False)
tissue_irae_expansion_pie = tissue_pie_data(adata_use=adata_hiit_tissue,
    groupby='disease_type', groupby_type='irAE_inflammation',
    ratioby='expansion_size', ratioby_type=['1', '2'],
    expanded=False)
tissue_stumor_expansion_pie = tissue_pie_data(adata_use=adata_hiit_tissue,
    groupby='disease_type', groupby_type='Solid tumor',
    ratioby='expansion_size', ratioby_type=['1', '2'],
    expanded=False)

expansion_size_color = ['#d4dced','#87a8d7','#39547d',]
fig,ax = plt.subplots(1,4)
ax[0].pie(tissue_healthy_expansion_pie[0], radius=1, colors=expansion_size_color,
          autopct='%1.0f%%', pctdistance=1.2, explode=(0,0,0.1), shadow=True, startangle=90)
ax[1].pie(tissue_inflam_expansion_pie[0], radius=1, colors=expansion_size_color,
          autopct='%1.0f%%', pctdistance=1.2, explode=(0,0,0.1), shadow=True, startangle=90)
ax[2].pie(tissue_irae_expansion_pie[0], radius=1, colors=expansion_size_color,
          autopct='%1.0f%%', pctdistance=1.2, explode=(0,0,0.1), shadow=True, startangle=90)
ax[3].pie(tissue_stumor_expansion_pie[0], radius=1, colors=expansion_size_color,
          autopct='%1.0f%%', pctdistance=1.2, explode=(0,0,0.1), shadow=True, startangle=90)
fig.savefig('figures/NB1_tissue_expansion_pie.pdf')
plt.show()

cell_subtype_check = ['ITGAE+ Trm', 'ITGB2+ Trm', 'CREM+ Trm',
                      'GZMK+ Tex', 'ITGAE+ Tex', 'Cycling T']
tissue_healthy_pie = tissue_pie_data(adata_use=adata_hiit_tissue,
    groupby='disease_type', groupby_type='Healthy',
    ratioby='cell_subtype_3', ratioby_type=cell_subtype_check,
    expanded=True)
tissue_inflam_pie = tissue_pie_data(adata_use=adata_hiit_tissue,
    groupby='disease_type', groupby_type='Inflammation',
    ratioby='cell_subtype_3', ratioby_type=cell_subtype_check,
    expanded=True)
tissue_irae_pie = tissue_pie_data(adata_use=adata_hiit_tissue,
    groupby='disease_type', groupby_type='irAE_inflammation',
    ratioby='cell_subtype_3', ratioby_type=cell_subtype_check,
    expanded=True)
tissue_stumor_pie = tissue_pie_data(adata_use=adata_hiit_tissue,
    groupby='disease_type', groupby_type='Solid tumor',
    ratioby='cell_subtype_3', ratioby_type=cell_subtype_check,
    expanded=True)

fig,ax = plt.subplots(1,4)
tissue_color = ['#279e68','#98df8a','#aa40fc','#c5b0d5','#c49c94','#f7b6d2','#f2f2f2']
ax[0].pie(tissue_healthy_pie[0], radius=1, colors=tissue_color,
          autopct='%1.0f%%', pctdistance=1.2,)
ax[1].pie(tissue_inflam_pie[0], radius=1, colors=tissue_color,
          autopct='%1.0f%%', pctdistance=1.2,)
ax[2].pie(tissue_irae_pie[0], radius=1, colors=tissue_color,
          autopct='%1.0f%%', pctdistance=1.2,)
ax[3].pie(tissue_stumor_pie[0], radius=1, colors=tissue_color,
          autopct='%1.0f%%', pctdistance=1.2,)
fig.savefig('figures/NB2_tissue_disease_pie.pdf')
plt.show()
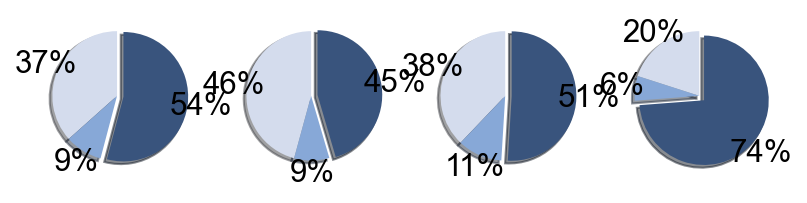
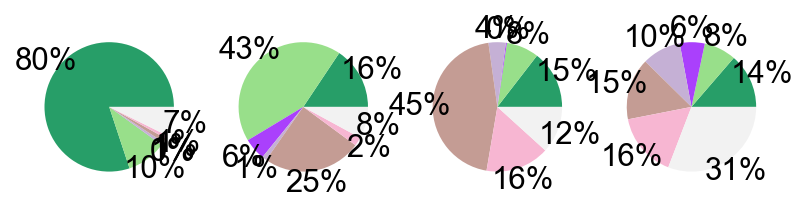
## SupFigures
disease_types_compare = ['Healthy', 'Inflammation', 'irAE_inflammation', 'Solid tumor']
tissue_subtypes = ['ITGAE+ Trm', 'ITGB2+ Trm', 'GZMK+ Tex', 'ITGAE+ Tex', 'Cycling T',]
disease_tissue_ratio = cell_ratio(adata=adata_hiit_tissue,
                                  groupby='disease_type',
                                  groups=disease_types_compare,
                                  subtypes=tissue_subtypes, expanded=True, total=True)
sep_multi_boxplot(disease_tissue_ratio,
                  xaxis='subtypes', yaxis='ratio', hueaxis='disease_types',
                  palette_list=hiit_color.values(),
                  file_name='figures/5C_expanded_tissue_ratio.pdf',)
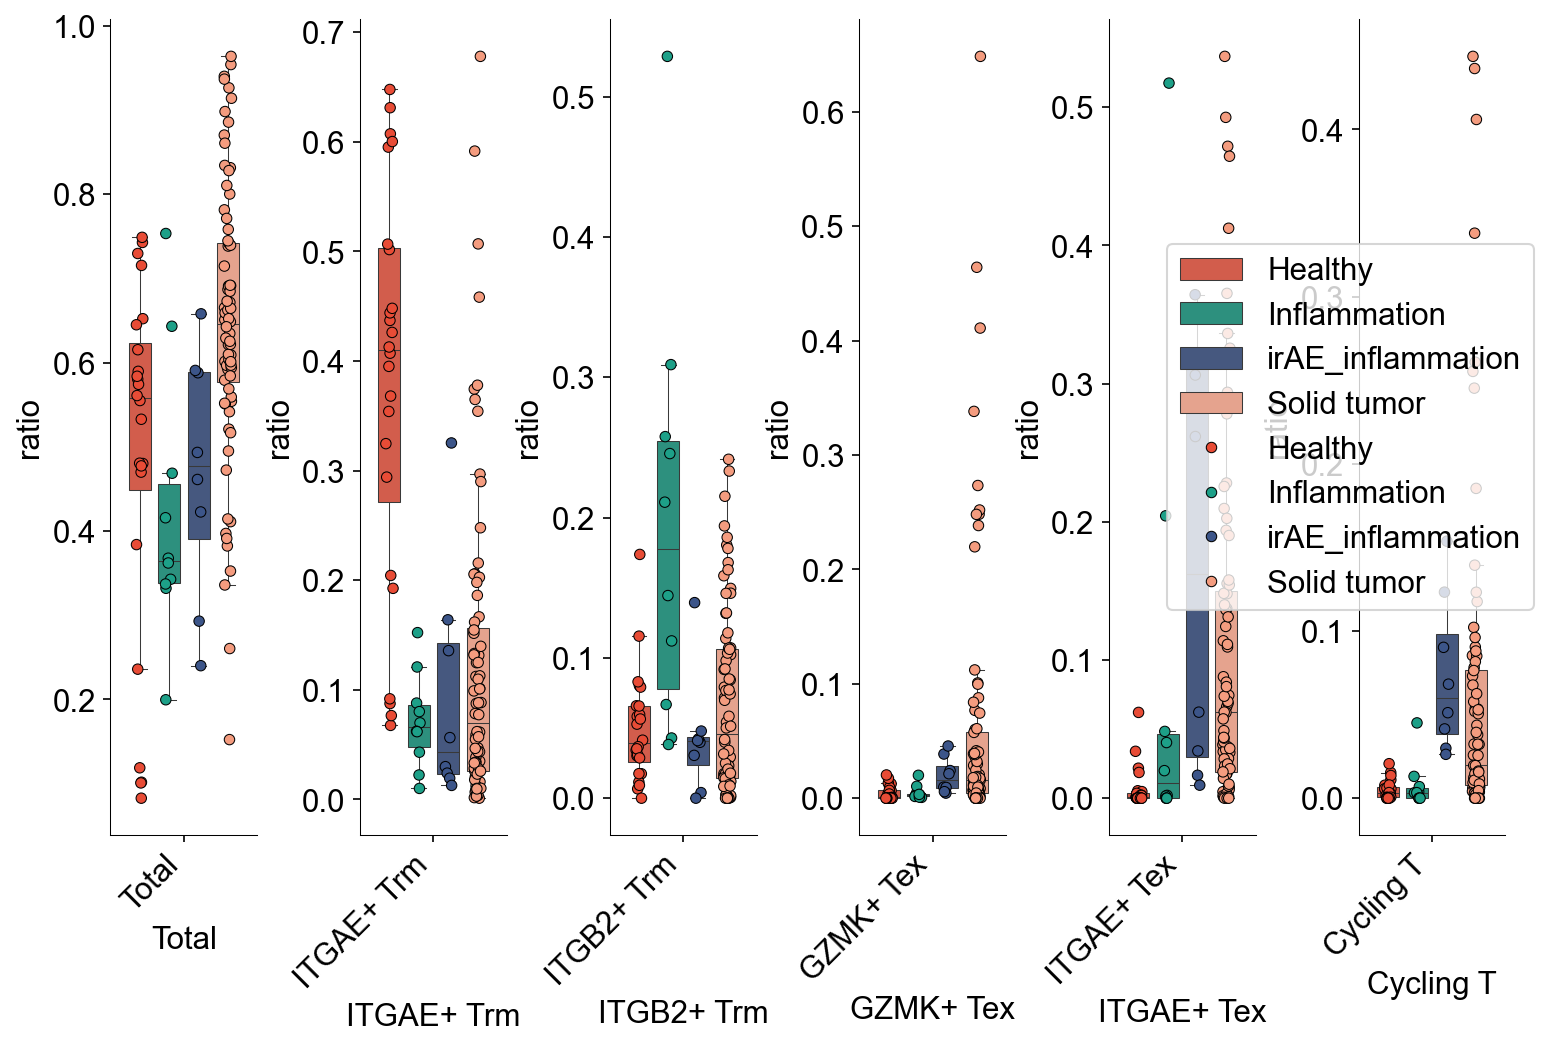
Counter(disease_tissue_ratio[disease_tissue_ratio['subtypes']=='ITGAE+ Trm'].disease_types)
Counter({'Healthy': 24,
         'Inflammation': 10,
         'irAE_inflammation': 8,
         'Solid tumor': 76})
scipy.stats.mannwhitneyu(disease_tissue_ratio[
    (disease_tissue_ratio['subtypes']=='GZMK+ Tex')&
    (disease_tissue_ratio['disease_types']=='irAE_inflammation')].ratio,
                  disease_tissue_ratio[
    (disease_tissue_ratio['subtypes']=='GZMK+ Tex')&
    (disease_tissue_ratio['disease_types']=='Healthy')].ratio)
MannwhitneyuResult(statistic=169.0, pvalue=0.001278510214255661)
GZMKTexvsITGB2Trm
adata_irae_inflam = adata_hiit_tissue[adata_hiit_tissue.obs['disease_type'].str.contains('nflammation')]
adata_irae_inflam.uns['log1p']['base'] = None
## adata_irae_inflam_healthy = adata_hiit_tissue[adata_hiit_tissue.obs['disease_type']!='Solid tumor']
## adata_irae_inflam_healthy.write_h5ad('source/adata_irae.h5ad')
adata_ii_allg = adata_gene[adata_gene.obs.index.isin(adata_irae_inflam.obs.index)]
sc.tl.rank_genes_groups(adata_ii_allg, groupby='cell_subtype_3',
                        groups=['ITGAE+ Tex'], reference='ITGB2+ Trm')
WARNING: Default of the method has been changed to 't-test' from 't-test_overestim_var'
fig,ax=ScanpyVolcanoPlot(
    adata_ii_allg, axis=0,
    label_fold_change=0.25, label_log_p=2,
    label_size=6 ,
    label_excludes=list(adata_ii_allg.var.index),
    label_includes=[
        'CD38',
        'CXCR6',
        'ENTPD1',
        'STAT1',
        'GZMB',
        'PRF1',
        'GNLY',
        #control
        'EOMES',
        'GZMK',
        'NKG7',
        'CRTAM',
        'TNFSF9',
        'CCL3',
        'CCL4',
        'CXCR4',
    ],
    color2=subtype_color['ITGAE+ Tex'],
    color1=subtype_color['ITGB2+ Trm'],
    size_by='cell_subtype_3',
    size_group='ITGAE+ Tex',
    size_reference='ITGB2+ Trm'
)
fig.set_size_inches((4,4))
fig.savefig('figures/NE1_noadj_ITGB_ITGAE_go_up.pdf')
Fraction of gene CD38 is 0.6835964310226493
Fraction of gene CXCR6 is 0.7750514756348662
Fraction of gene ENTPD1 is 0.55044612216884
Fraction of gene STAT1 is 0.6607755662319835
Fraction of gene GZMB is 0.779512697323267
Fraction of gene PRF1 is 0.8490048043925875
Fraction of gene GNLY is 0.5628002745367193
Fraction of gene EOMES is 0.10175017158544955
Fraction of gene GZMK is 0.31846259437199725
Fraction of gene NKG7 is 0.952299245024022
Fraction of gene CRTAM is 0.23867536032944406
Fraction of gene TNFSF9 is 0.30593685655456415
Fraction of gene CCL3 is 0.36942347288949895
Fraction of gene CCL4 is 0.6820521619766644
Fraction of gene CXCR4 is 0.433939601921757
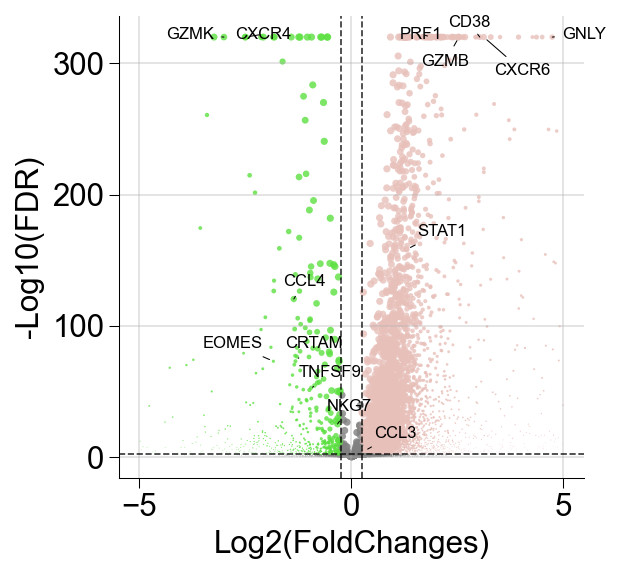
## list contains: deg_tex,deg_tex_up,deg_tex_dw,enr_tex_up,enr_tex_dw
adata_ii_allg.uns['log1p']['base'] = None
tex_trm_list = DEG_analysis(adata_ii_allg, groupby='cell_subtype_3',
                            query_subtype='ITGAE+ Tex',reference_subtype='ITGB2+ Trm')
tex_trm_list[3].res2d.Term = tex_trm_list[3].res2d.Term.str.split(" \(GO").str[0]
## dotplot
gseapy.dotplot(tex_trm_list[3].res2d.iloc[[3,5,30,40,80,103,151],:], size=10,
               top_term=25, title='Up', cmap='Reds',
               figsize=(3,10))

plt.savefig('figures/NNE_ITGB_ITGAE_go_up.pdf')
plt.show()
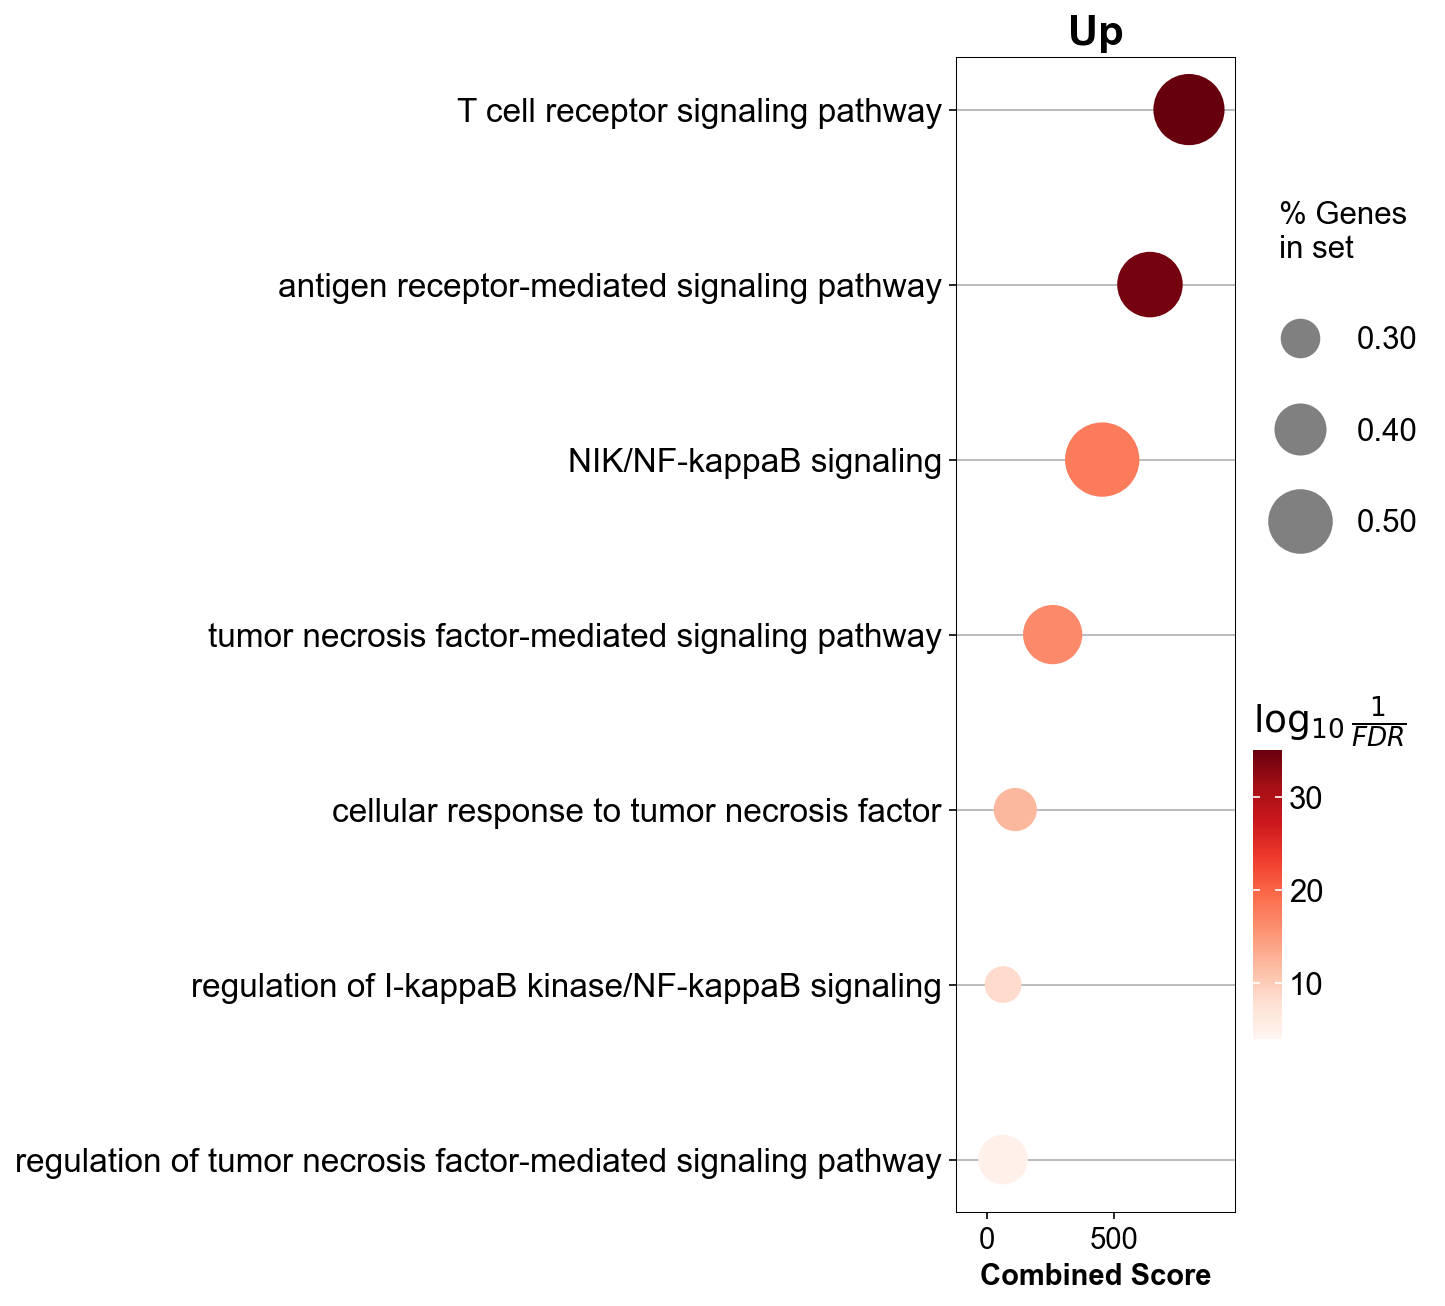
ClonotypeRelated
Functions
def expansion_ratio(df_list, df_name_list, subtype_list, exp_num=3, total=True):

    def condition_cell_ratio(df, subtypes, exp_num):

        x0 = pd.DataFrame([])
        df_test = df[df['total']>=exp_num]

        if total == True:
            a = pd.Series(Counter(df_test.individual_id))
            b = pd.Series(Counter(df.individual_id))
            c = pd.concat([a,b],axis=1)
            c[0] = c[0].fillna(0)

            x = pd.DataFrame({"ratio":c[0]/c[1]})
            x['sharing_type'] = 'Total'
            x0 = pd.concat([x0, x])

        for i in subtypes:
            ## Expansion
            if isinstance(i,list):
                a1 = pd.Series(Counter(df_test[df_test["dominant"].isin(i)].individual_id))
                b1 = pd.Series(Counter(df.individual_id))
                c1 = pd.concat([a1,b1],axis=1)
                c1[0] = c1[0].fillna(0)

                x1 = pd.DataFrame({"ratio":c1[0]/c1[1]})
                x1['sharing_type'] = list(np.repeat(i[0], len(x1)))
                x0 = pd.concat([x0,x1])
            else:
                a1 = pd.Series(Counter(df_test[df_test["dominant"]==i].individual_id))
                b1 = pd.Series(Counter(df.individual_id))
                c1 = pd.concat([a1,b1],axis=1)
                c1[0] = c1[0].fillna(0)

                x1 = pd.DataFrame({"ratio":c1[0]/c1[1]})
                x1['sharing_type'] = list(np.repeat(i, len(x1)))
                x0 = pd.concat([x0,x1])

        return x0

    expansion_df = pd.DataFrame([])
    for i,j in zip(df_list, df_name_list):
        expansion_condition = condition_cell_ratio(i, subtypes=subtype_list, exp_num=exp_num)
        expansion_condition['condition'] = list(np.repeat(j, len(expansion_condition)))
        expansion_df = pd.concat([expansion_df, expansion_condition])

    return expansion_df
Circulating
clone_hiit_circ = clone_df_generate(adata_hiit_circ)
clone_hiit_circ_healthy = clone_hiit_circ[clone_hiit_circ['disease_type']=='Healthy']
clone_hiit_circ_inflam = clone_hiit_circ[clone_hiit_circ['disease_type']=='Inflammation']
clone_hiit_circ_irae = clone_hiit_circ[clone_hiit_circ['disease_type']=='irAE_inflammation']
clone_hiit_circ_stumor = clone_hiit_circ[clone_hiit_circ['disease_type']=='Solid tumor']
circ_subtypes=[['Tcm', 'Early Tcm/Tem', 'GZMK+ Tem'], 'GNLY+ Temra', 'CMC1+ Temra']
HI_expansion_circ = expansion_ratio(df_list=[clone_hiit_circ_healthy,clone_hiit_circ_inflam,
                                             clone_hiit_circ_irae,clone_hiit_circ_stumor],
                                    df_name_list=['Healthy', 'Inflammation', 'irAE_inflammation', 'TN_tumor'],
                                    subtype_list=circ_subtypes,
                                    exp_num=3)
HI_expansion_circ
| ratio | sharing_type | condition | |
|---|---|---|---|
| HUP217 | 0.155148 | Total | Healthy |
| HUP213 | 0.106259 | Total | Healthy |
| HUP222 | 0.090864 | Total | Healthy |
| F014 | 0.009098 | Total | Healthy |
| HD4 | 0.034483 | Total | Healthy |
| ... | ... | ... | ... |
| PT_5 | 0.000000 | CMC1+ Temra | TN_tumor |
| PT_4 | 0.000000 | CMC1+ Temra | TN_tumor |
| PT_6 | 0.000000 | CMC1+ Temra | TN_tumor |
| PT_1 | 0.000000 | CMC1+ Temra | TN_tumor |
| E1 | 0.000000 | CMC1+ Temra | TN_tumor |
420 rows × 3 columns
## Figure3B
sep_multi_boxplot(HI_expansion_circ,
                  xaxis='sharing_type', yaxis='ratio', hueaxis='condition',
                  palette_list=hiit_color.values(),
                  file_name='figures/D_expansion_circ.pdf')
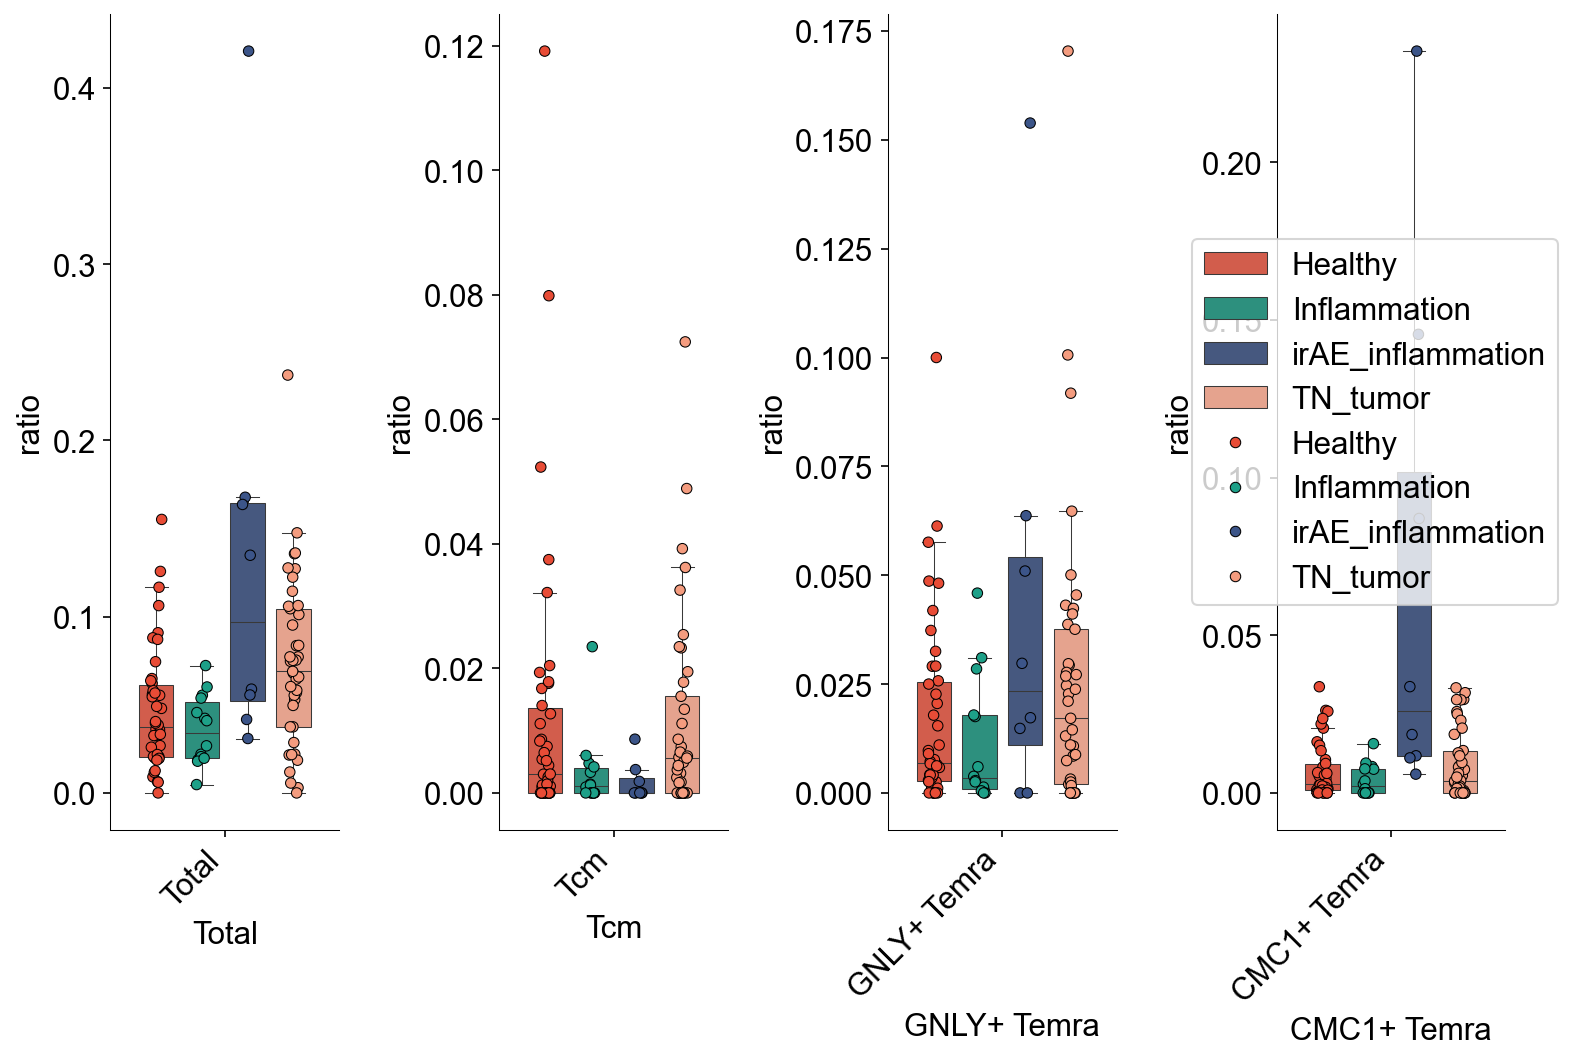
Counter(HI_expansion_circ[HI_expansion_circ['sharing_type']=='Tcm'].condition)
Counter({'Healthy': 42,
         'Inflammation': 14,
         'irAE_inflammation': 8,
         'TN_tumor': 41})
scipy.stats.mannwhitneyu(HI_expansion_circ[(HI_expansion_circ['sharing_type']=='CMC1+ Temra') &
                                    (HI_expansion_circ['condition']=='Healthy')].ratio,
                  HI_expansion_circ[(HI_expansion_circ['sharing_type']=='CMC1+ Temra') &
                                    (HI_expansion_circ['condition']=='irAE_inflammation')].ratio)
MannwhitneyuResult(statistic=39.0, pvalue=0.000661514802694257)
Tissue
clone_hiit_tissue = clone_df_generate(adata_hiit_tissue_arth)
clone_hiit_tissue_healthy = clone_hiit_tissue[clone_hiit_tissue['disease_type']=='Healthy']
clone_hiit_tissue_inflam = clone_hiit_tissue[clone_hiit_tissue['disease']=='Ulcerative colitis']
clone_hiit_tissue_irae = clone_hiit_tissue[clone_hiit_tissue['disease']=='CPI-colitis']
clone_hiit_tissue_stumor = clone_hiit_tissue[clone_hiit_tissue['disease_type']=='Solid tumor']
tissue_subtypes=['ITGAE+ Trm', 'ITGB2+ Trm', 'GZMK+ Tex', 'ITGAE+ Tex']
HI_expansion_tissue = expansion_ratio(df_list=[clone_hiit_tissue_healthy,clone_hiit_tissue_inflam,
                                               clone_hiit_tissue_irae,clone_hiit_tissue_stumor],
                                      df_name_list=['Healthy', 'UC', 'irAE_colitis', 'TN_tumor'],
                                      subtype_list=tissue_subtypes, exp_num=3)
HI_expansion_tissue
| ratio | sharing_type | condition | |
|---|---|---|---|
| nc_CT3 | 0.151675 | Total | Healthy |
| C19 | 0.025707 | Total | Healthy |
| CPInc_NC5 | 0.148052 | Total | Healthy |
| nc_CT6 | 0.168067 | Total | Healthy |
| nc_CT7 | 0.200820 | Total | Healthy |
| ... | ... | ... | ... |
| B230498 | 0.000000 | ITGAE+ Tex | TN_tumor |
| ccRCC_1 | 0.000000 | ITGAE+ Tex | TN_tumor |
| GU0715 | 0.000000 | ITGAE+ Tex | TN_tumor |
| su001 | 0.000000 | ITGAE+ Tex | TN_tumor |
| MDA1_T01 | 0.000000 | ITGAE+ Tex | TN_tumor |
590 rows × 3 columns
## Figure3D
sep_multi_boxplot(HI_expansion_tissue,
                  xaxis='sharing_type', yaxis='ratio', hueaxis='condition',
                  palette_list=hiit_color.values(),
                  file_name='figures/A_expansion_tissue.pdf',)
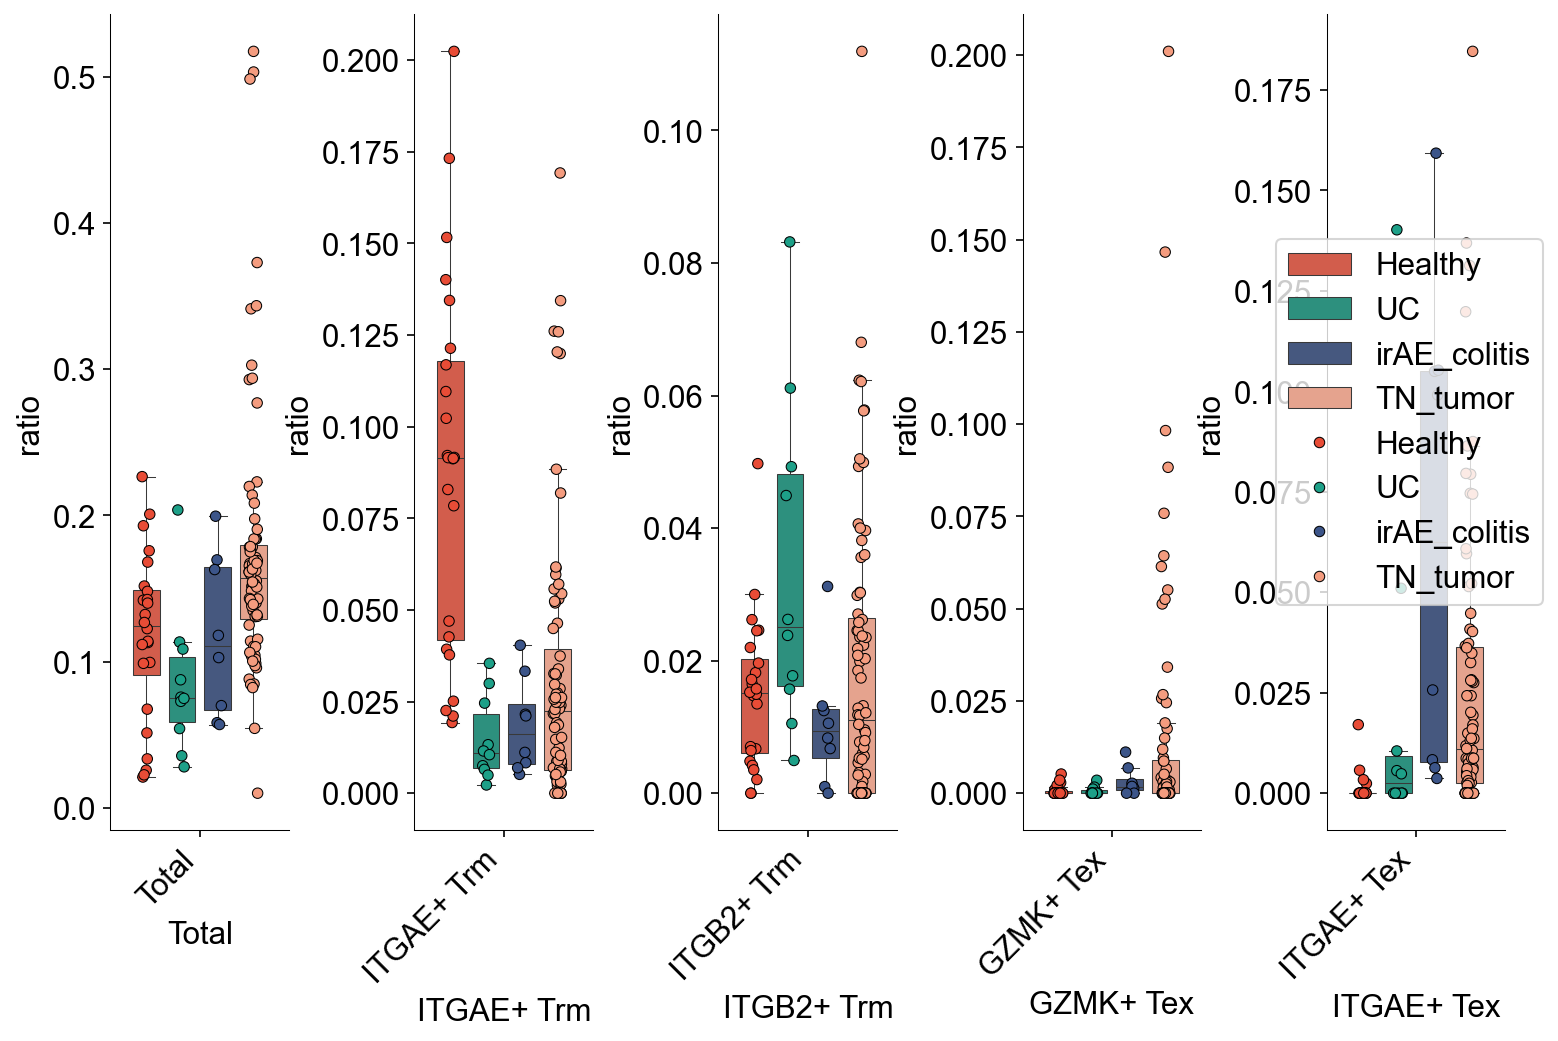
Counter(HI_expansion_tissue[(HI_expansion_tissue['sharing_type']=='GZMK+ Tex')]['condition'])
Counter({'Healthy': 24, 'UC': 10, 'irAE_colitis': 8, 'TN_tumor': 76})
scipy.stats.mannwhitneyu(HI_expansion_tissue[(HI_expansion_tissue['sharing_type']=='ITGAE+ Tex') &
                                       (HI_expansion_tissue['condition']=='Healthy')].ratio,
                         HI_expansion_tissue[(HI_expansion_tissue['sharing_type']=='ITGAE+ Tex') &
                                       (HI_expansion_tissue['condition']=='irAE_colitis')].ratio)
MannwhitneyuResult(statistic=4.0, pvalue=4.670615600448874e-06)
SupColitisVsArthritis
adata_irae_arth = adata_nogex[adata_nogex.obs['study_name'].str.contains('Kim_2022')]
adata_irae_arth_circ = adata_irae_arth[adata_irae_arth.obs['meta_tissue_type_aggr'] == 'Circulating']
adata_irae_arth_tissue = adata_irae_arth[adata_irae_arth.obs['meta_tissue_type'].str.contains('Tissue')]
adata_irae_colitis = adata_nogex[adata_nogex.obs['disease'].str.contains("CPI-colitis")]

target_cells = 8486
cluster_key = 'disease'
adata = sc.concat([adata_irae_colitis, adata_irae_arth_tissue]) ## minimum #cell=9400

adatas = [adata[adata.obs[cluster_key]==clust] for clust in np.unique(adata.obs[cluster_key])]

for dat in adatas:
    if dat.n_obs > target_cells:
         sc.pp.subsample(dat, n_obs=target_cells)

adata_downsampled = adatas[0].concatenate(*adatas[1:])
adata_downsampled.obs.index = [ '-'.join(i.split('-')[0:3]) for i in adata_downsampled.obs.index ]
adata_nogex.obs['expanded_distribution'] = None
adata_nogex.obs.loc[
    adata_downsampled.obs[
        adata_downsampled.obs['cc_aa_identity']>=3
    ].index, 'expanded_distribution'
] = adata_downsampled.obs['disease']
fig,ax = plt.subplots(figsize=(5,5))

sc.pl.umap(adata_nogex, color='expanded_distribution', size=10, na_color='#f7f7f7',
           ax=ax, palette=['#ff707e','#3f5070'])

fig.savefig('figures/B_arth_colitis.png', dpi=600)
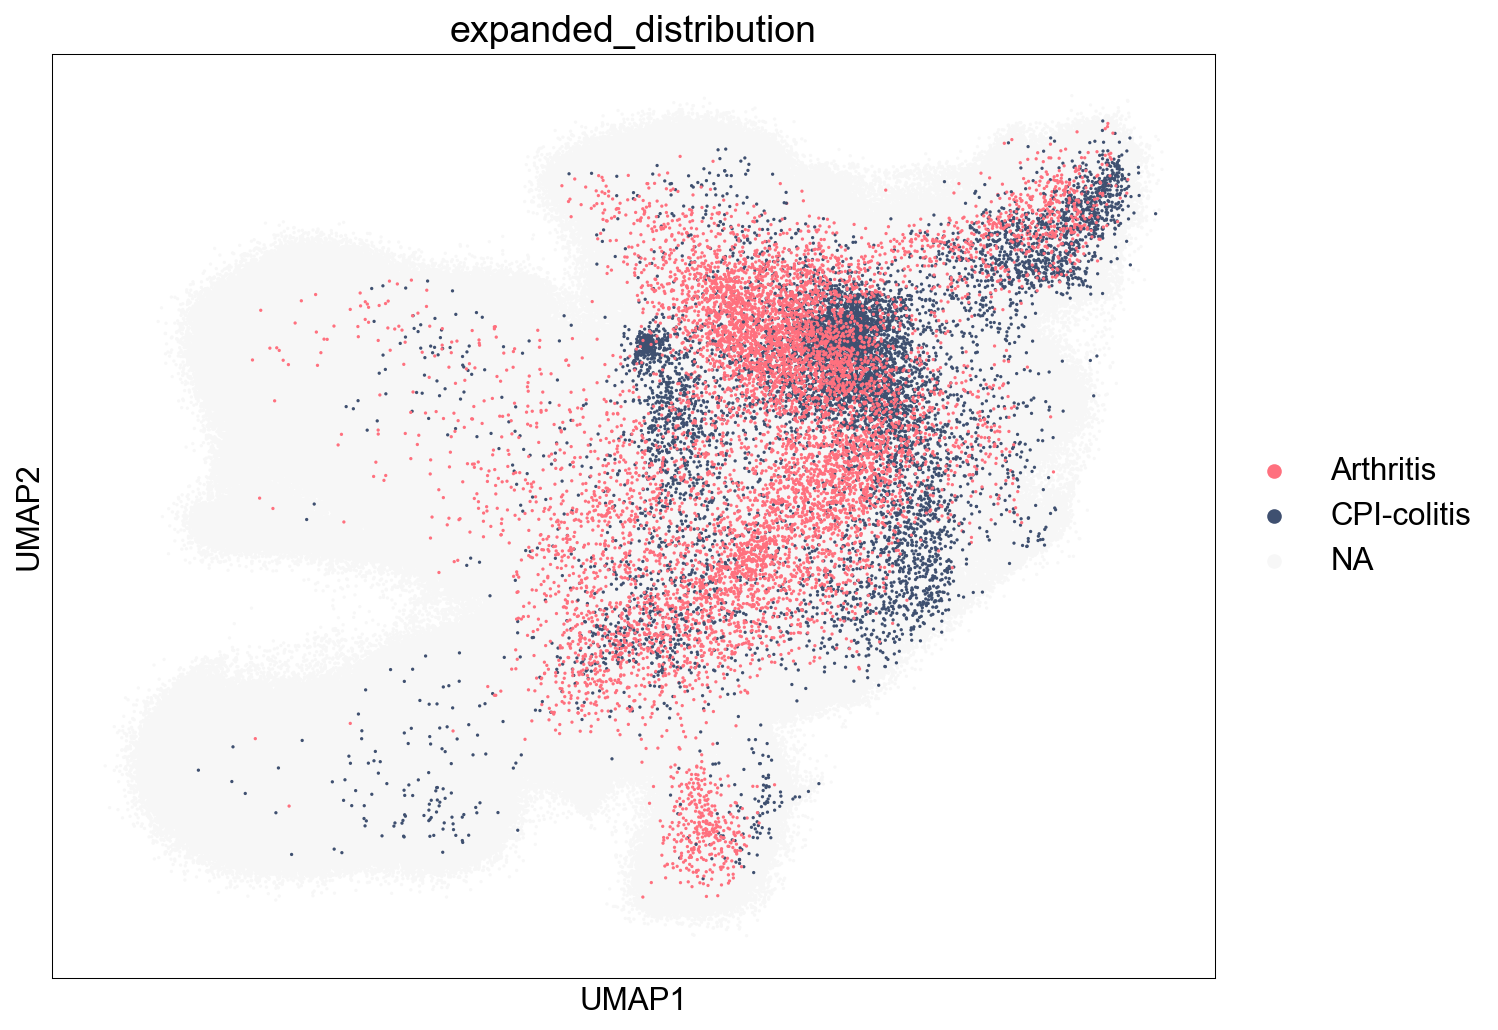
arth_tissue_expansion_pie = tissue_pie_data(adata_use=adata_irae_arth_tissue,
    groupby='disease_type', groupby_type='irAE_inflammation',
    ratioby='expansion_size', ratioby_type=['1', '2'],
    expanded=False)

arth_tissue_subtypes = cell_subtypes[1:]
arth_ratio = tissue_pie_data(adata_use=adata_hiit_tissue_arth,
    groupby='disease', groupby_type='Arthritis',
    ratioby='cell_subtype_3', ratioby_type=arth_tissue_subtypes,
    expanded=True)

fig,ax = plt.subplots(1,2)
ax[0].pie(arth_tissue_expansion_pie[0], radius=1, colors=expansion_size_color,
       autopct='%1.0f%%', pctdistance=1.2, explode=(0,0,0.1), shadow=True,startangle=90)
ax[1].pie(arth_ratio[0], radius=1, colors=list(subtype_color.values())[1:],
       autopct='%1.0f%%', pctdistance=1.2)

fig.savefig('figures/C_rth_pie.pdf')
plt.show()
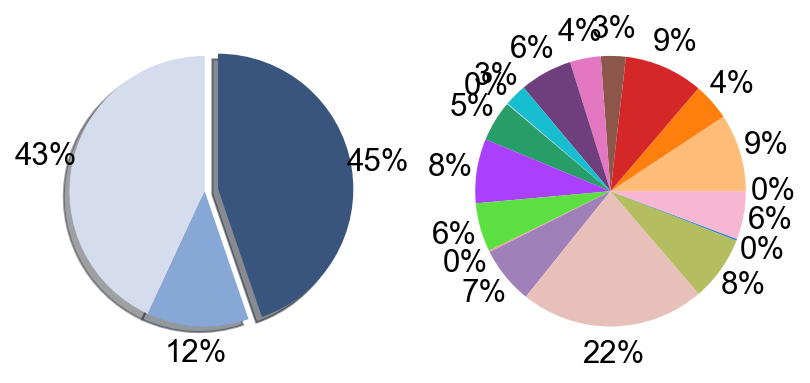
ILTCKrelatedAnalysis
fig,ax = plt.subplots(figsize=(5,5))
sc.pl.umap(adata_nogex, color=['FCER1G'], cmap='Reds', ax=ax)
fig.savefig('figures/A0_FCER1G_umap.png', dpi=600)

fig,ax = plt.subplots(figsize=(5,5))
sc.pl.umap(adata_nogex, color=['TYROBP'], cmap='Reds', ax=ax)
fig.savefig('figures/A1_TYROBP_umap.png', dpi=600)

fig,ax = plt.subplots(figsize=(5,5))
sc.pl.violin(adata_nogex, keys=['FCER1G'], groupby='cell_subtype_3',
             stripplot=False, rotation=45, ax=ax)
fig.savefig('figures/A2_FCER1G_violin.pdf')

fig,ax = plt.subplots(figsize=(5,5))
sc.pl.violin(adata_nogex, keys=['TYROBP'], groupby='cell_subtype_3',
             stripplot=False, rotation=45, ax=ax)
fig.savefig('figures/A3_TYROBP_violin.pdf')
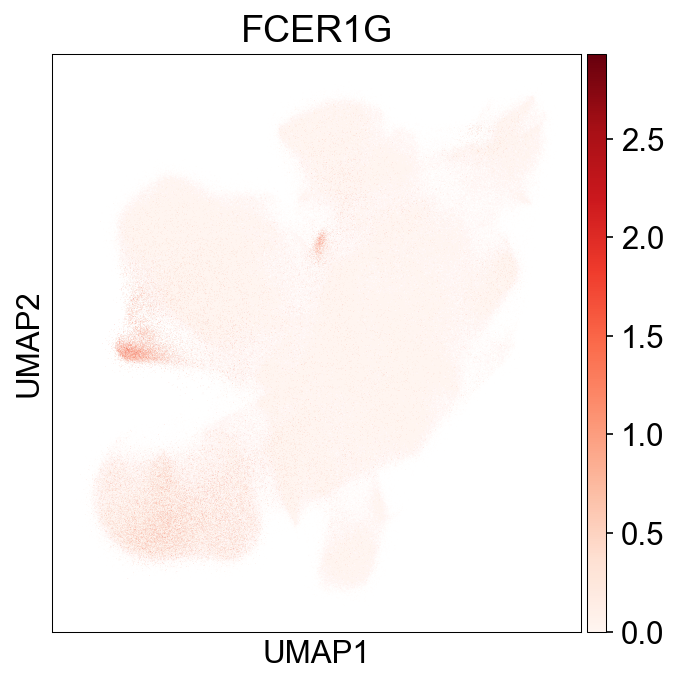
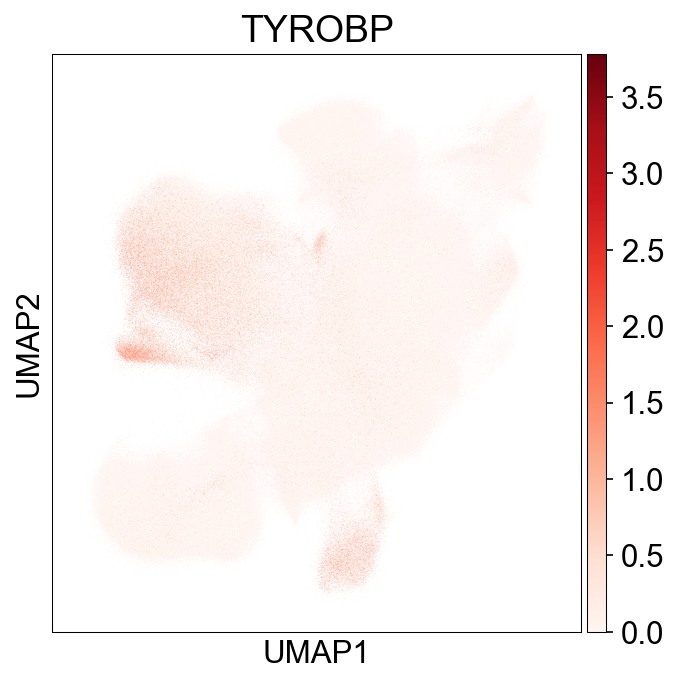
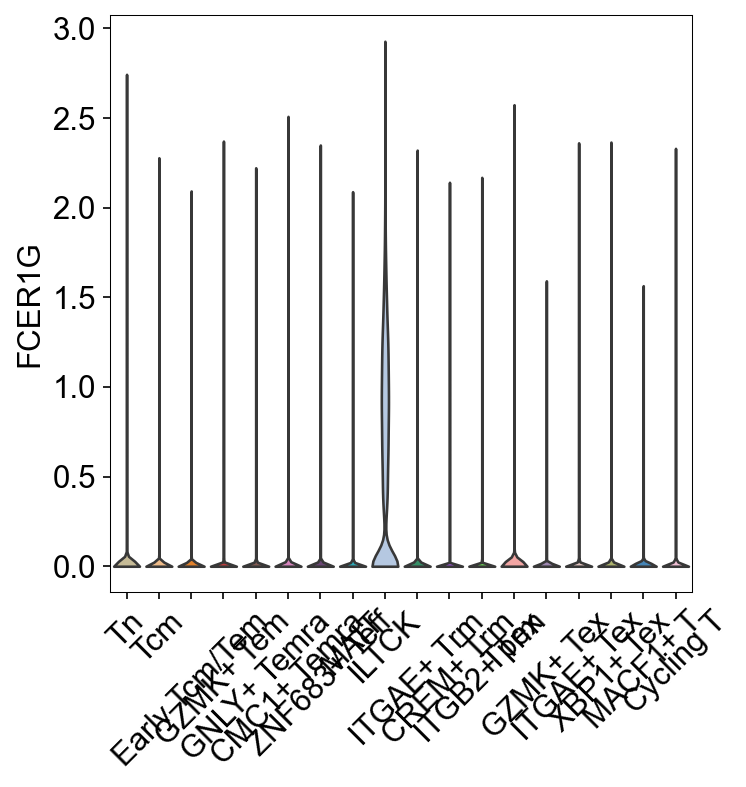
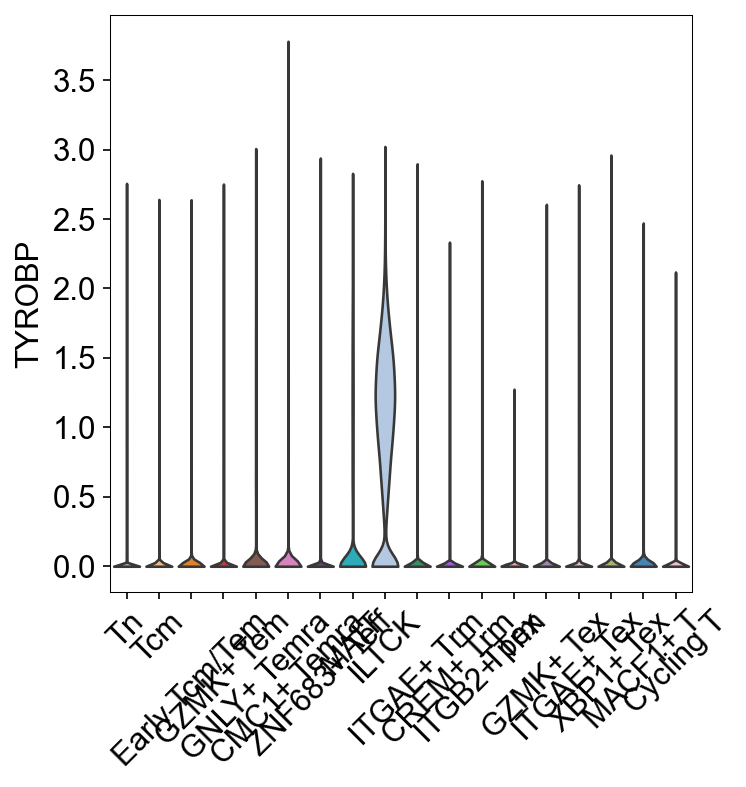
adata_iltck = adata_nogex[adata_nogex.obs['cell_subtype_3']=='ILTCK']
adata_iltck_noorg = adata_iltck[adata_iltck.obs['disease_type']!='Organoid']
adata_iltck_noorg_filter = adata_iltck_noorg[~adata_iltck_noorg.obs['disease_type'].isin(['Fraility', 'Myeloma'])]
Counter(adata_iltck_noorg_filter.obs['disease_type'])
Counter({'Healthy': 1740,
         'Infection': 10715,
         'Inflammation': 1082,
         'Solid tumor': 4189,
         'Leukemia': 1068,
         'irAE_inflammation': 290})
target_cells = 290
cluster_key = 'disease_type'
adata = adata_iltck_noorg_filter

adatas = [adata[adata.obs[cluster_key]==clust] for clust in np.unique(adata.obs[cluster_key])]

for dat in adatas:
    if dat.n_obs > target_cells:
         sc.pp.subsample(dat, n_obs=target_cells)

adata_downsampled = adatas[0].concatenate(*adatas[1:])
adata_downsampled.obs.index = [ '-'.join(i.split('-')[:-1]) for i in adata_downsampled.obs.index ]
Counter(adata_downsampled.obs['disease_type'])
Counter({'Healthy': 290,
         'Infection': 290,
         'Inflammation': 290,
         'Leukemia': 290,
         'Solid tumor': 290,
         'irAE_inflammation': 290})
## Cell subtype marker, Figure1C
## Cell subtype marker, Figure1C
fig,ax = plt.subplots(figsize=(10,8))
sc.pl.dotplot(adata_downsampled, var_names=['TYROBP','FCER1G',
                                            'CCR7', 'TCF7', 'LEF1', 'SELL',
                                            'NKG7', 'CCL4', 'CST7',
                                            'PRF1', 'GZMA', 'GZMB',
                                            'IFNG', 'CCL3', 'FGFBP2',
                                            'PDCD1', 'TIGIT', 'LAG3',
                                            'HAVCR2', 'CTLA4'],
              groupby='disease_type', dot_max=0.7,
              standard_scale='var', ax=ax,)
fig.savefig('figures/B_marker_genes.pdf')
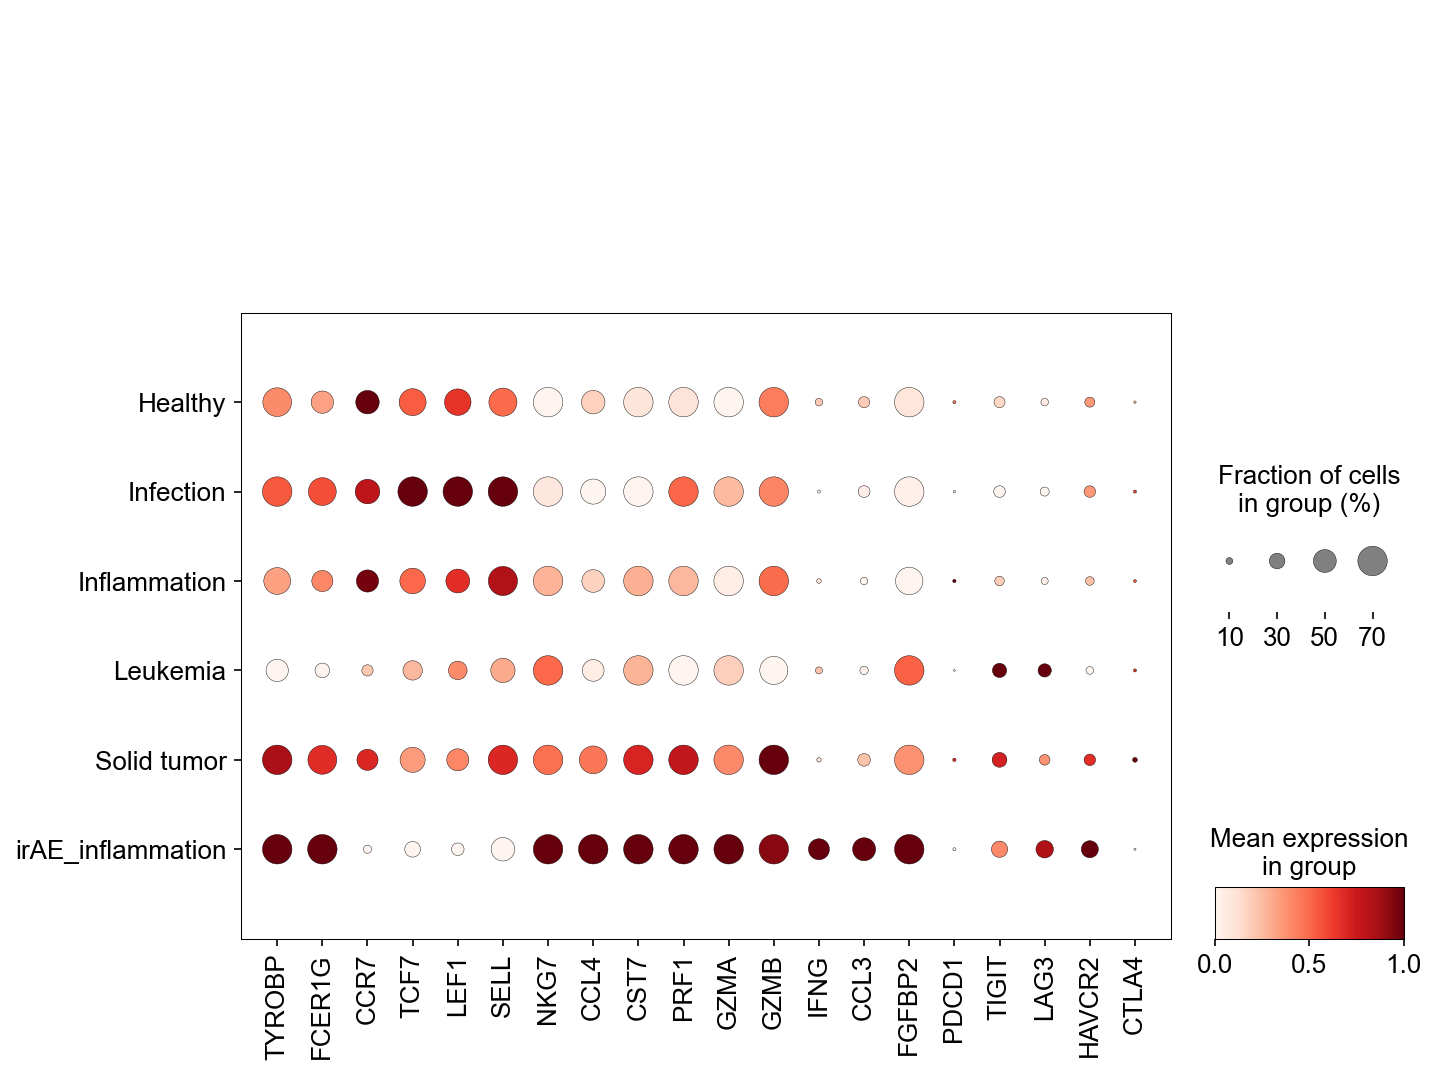
## filter cell number too low
larger_id = [x for x,y in Counter(adata_circ_nokid.obs.individual_id).items() if y>100]
adata_circ_nokid_mod = adata_circ_nokid[adata_circ_nokid.obs['individual_id'].isin(larger_id)]
iltck_ratio = cell_ratio(adata=adata_circ_nokid_mod,
                         groupby='disease_type',
                         groups=disease_types,
                         subtypeby='cell_subtype_3',
                         subtypes=['ILTCK'], expanded=False, total=False)
iltck_expansion_ratio = cell_ratio(adata=adata_circ_nokid_mod,
                                   groupby='disease_type',
                                   groups=disease_types,
                                   subtypeby='cell_subtype_3',
                                   subtypes=['ILTCK'], expanded=True, total=False)
multi_boxplot(iltck_ratio,
              xaxis='subtypes', yaxis='ratio', hueaxis='disease_types',
              palette_list=disease_type_color.values(),
              file_name='figures/C_iltck_ratio.pdf')
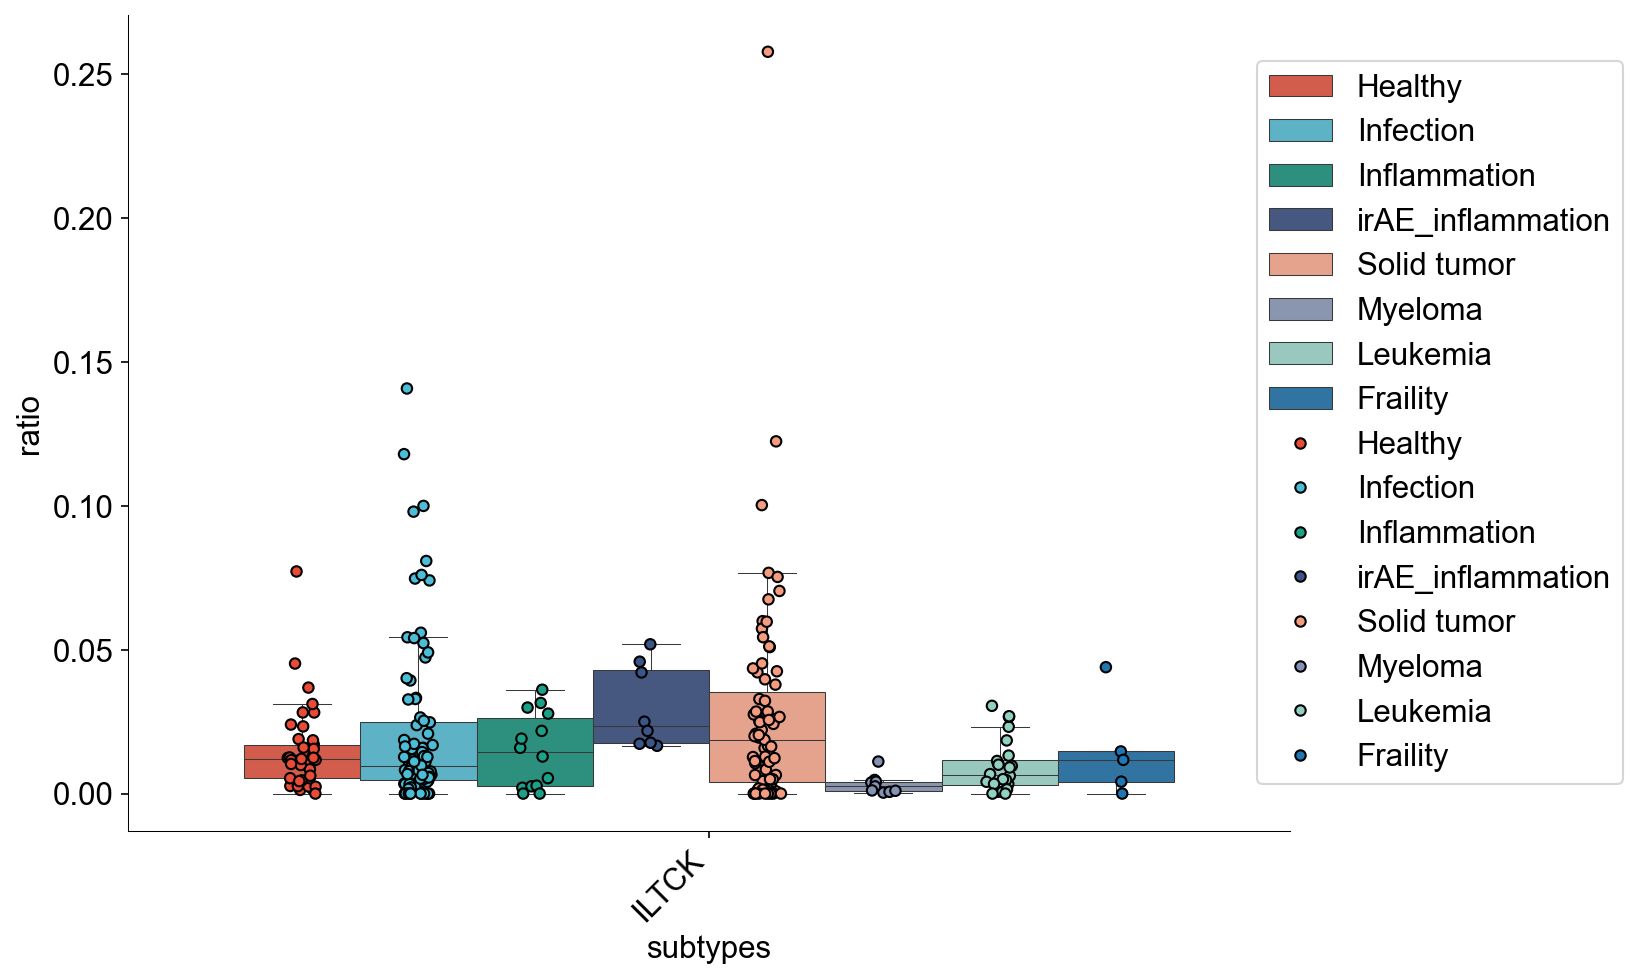
scipy.stats.mannwhitneyu(iltck_ratio[(iltck_ratio['subtypes']=='ILTCK') &
                                     (iltck_ratio['disease_types']=='irAE_inflammation')].ratio,
                         iltck_ratio[(iltck_ratio['subtypes']=='ILTCK') &
                                     (iltck_ratio['disease_types']=='Healthy')].ratio)
MannwhitneyuResult(statistic=287.0, pvalue=0.0008866770917413089)
multi_boxplot(iltck_expansion_ratio,
              xaxis='subtypes', yaxis='ratio', hueaxis='disease_types',
              palette_list=disease_type_color.values(),
              file_name='figures/iltck_expansion_ratio.pdf')
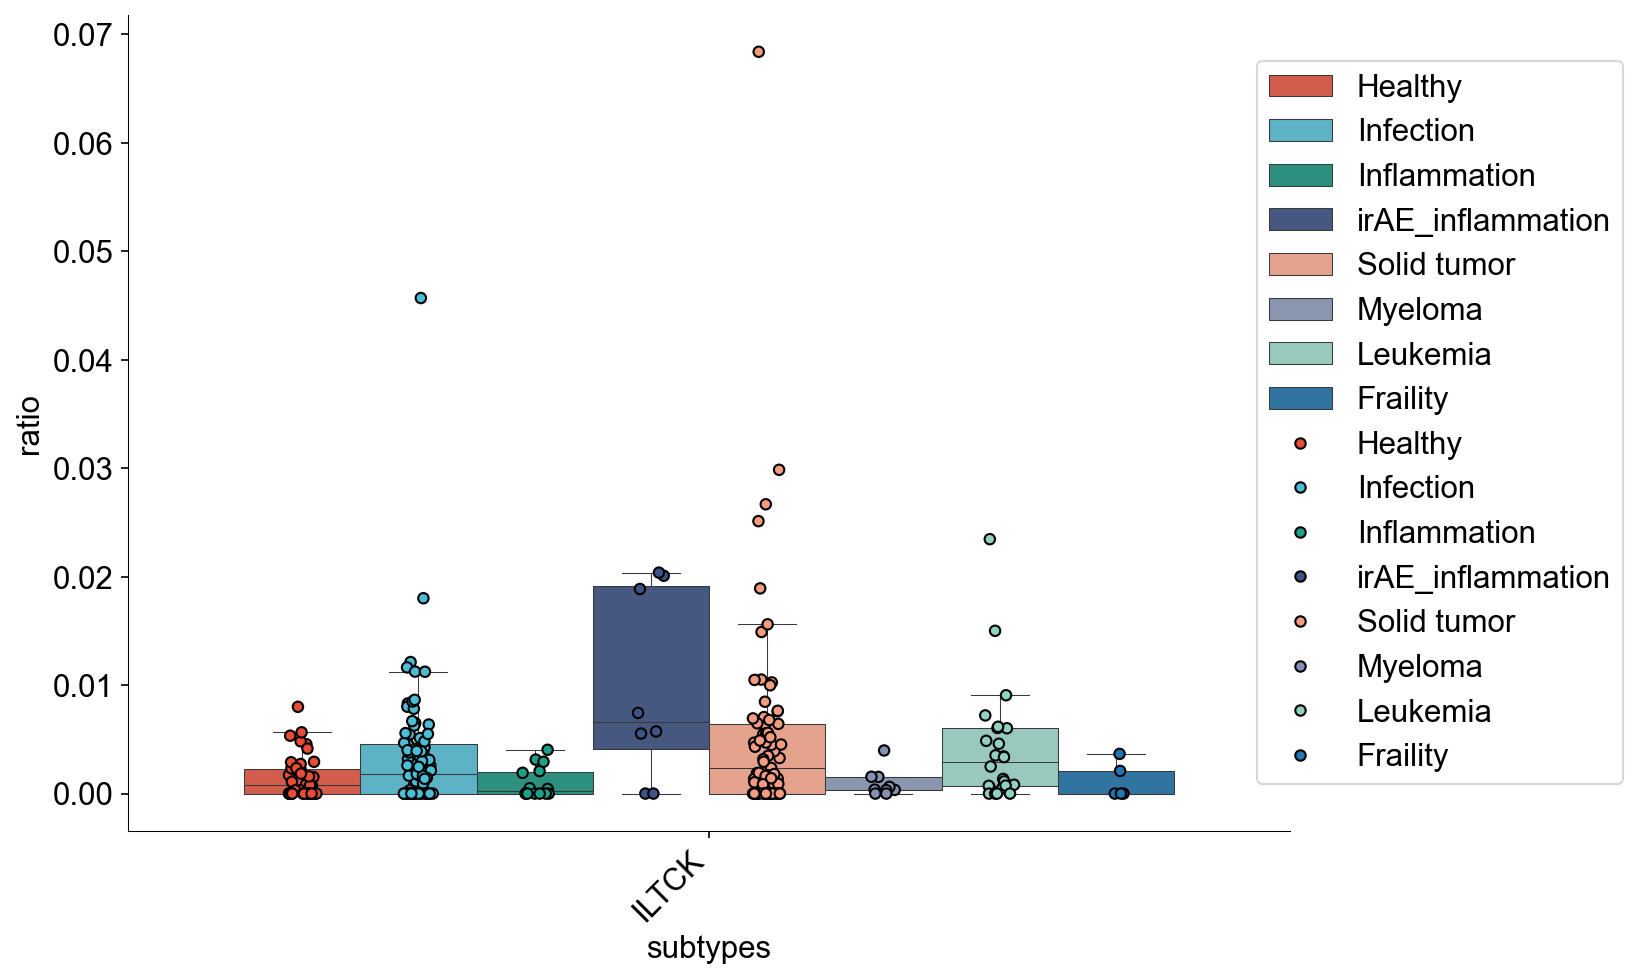
in Solid Tumor
adata_circ_nokid_mod_stumor = adata_circ_nokid_mod[adata_circ_nokid_mod.obs['disease_type'].isin([
    'Healthy',
    'Solid tumor'
])]
adata_circ_nokid_mod_stumor.obs.loc[
    adata_circ_nokid_mod_stumor.obs['disease_type']=='Healthy', 'disease'] = 'Healthy'
iltck_expansion_ratio_stumor = cell_ratio(adata=adata_circ_nokid_mod_stumor,
                                   groupby='disease',
                                   groups=np.unique(adata_circ_nokid_mod_stumor.obs['disease']),
                                   subtypeby='cell_subtype_3',
                                   subtypes=['ILTCK'], expanded=True, total=False)
stumor_color = {
##     'Basal cell carinoma tumor':'#D16100',
    'Breast Cancer':'#DDEFFF',
    'Cholangiocarcinoma':'#300018',
    'Clear cell renal cell carcinoma':'#0AA6D8',
    'Endometrial Carcinoma':'#00846F',
##     'Esophagus squamous cell carcinoma':'#372101',
    'Gallbladder Cancer':'#a37def',
    'Gastric Cancer':'#C2FFED',
    'HNSCC':'#C2FF99',
    'Healthy': '#E84C36',
    'Human thymic epithelial tumors (TET)':'#001E09',
    'Melanoma':'#788D66',
    'NSCLC':'#FF8A9A',
    'Nasopharyngeal carcinoma':'#D157A0',
    'Ovarian Cancer':'#8ffacd',
##     'Pancreatic Cancer':'#886F4C',
##     'Prostate Cancer':'#34362D',
##     'Squamous cell carcinoma tumor':'#452C2C',
    'low-grade gliomas':'#FF913F'
}
multi_boxplot(iltck_expansion_ratio_stumor,
              xaxis='subtypes', yaxis='ratio', hueaxis='disease_types',
              palette_list=stumor_color.values(),
              file_name='figures/E_iltck_expansion_stumor_ratio.pdf')
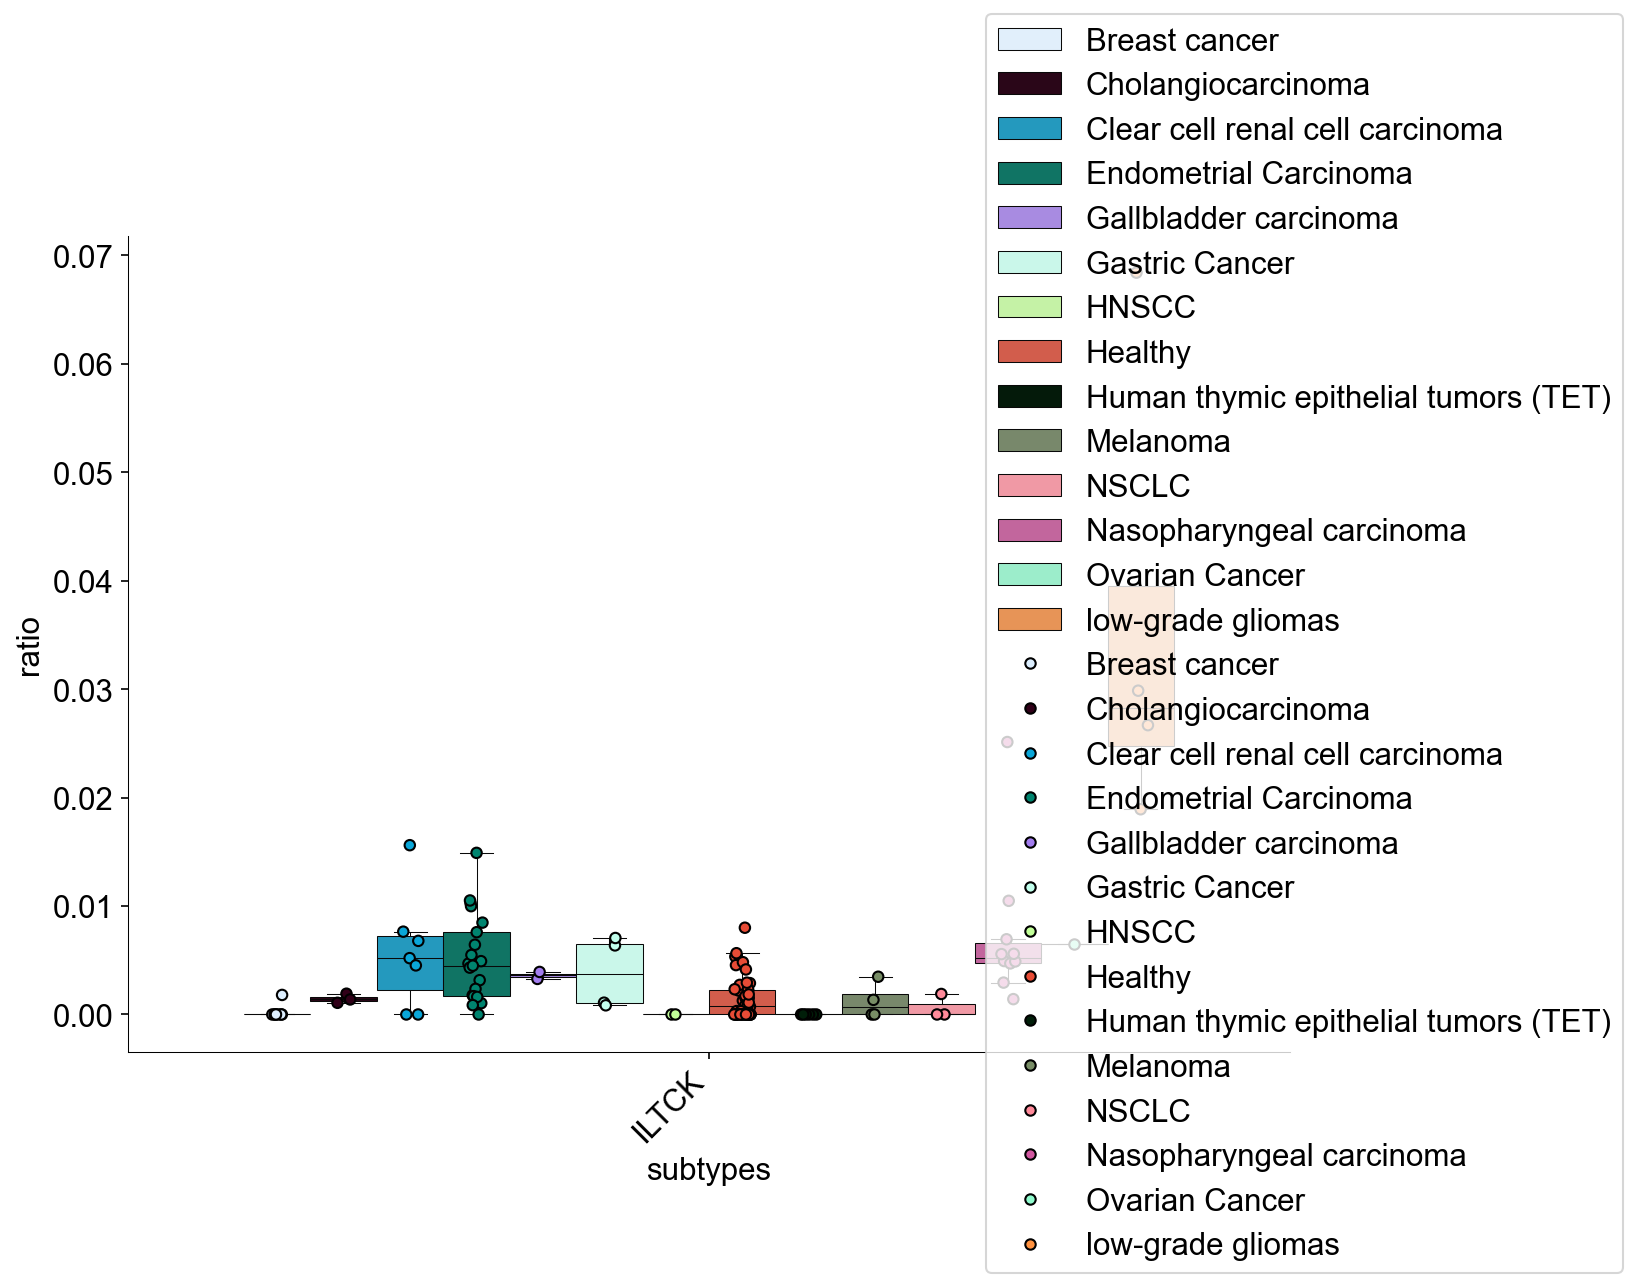
scipy.stats.mannwhitneyu(iltck_expansion_ratio_stumor[(iltck_expansion_ratio_stumor['subtypes']=='ILTCK') &
                                     (iltck_expansion_ratio_stumor['disease_types']=='Healthy')].ratio,
                         iltck_expansion_ratio_stumor[(iltck_expansion_ratio_stumor['subtypes']=='ILTCK') &
                                     (iltck_expansion_ratio_stumor['disease_types']=='low-grade gliomas')].ratio)
MannwhitneyuResult(statistic=0.0, pvalue=0.0007878715152823129)
ExpansionAnalysis
clone_iltck = clone_subtype[(clone_subtype['first']=='ILTCK') |
                            (clone_subtype['second']=='ILTCK')]
clone_iltck[clone_iltck['dominant']=='MAIT']
clone_iltck.to_csv('source/20231231ILTCKclone.csv')
iltck_circos = circos_edges(clone_subtype,
                            subtypes=np.setdiff1d(cell_subtypes,'ILTCK'),
                            specific_subtype='ILTCK',
                            file_name='figures/F_iltck_clonotype.csv')
iltck_circos
| source | target | value | |
|---|---|---|---|
| 0 | ILTCK | CMC1+ Temra | 100 |
| 1 | ILTCK | CREM+ Trm | 1 |
| 3 | ILTCK | Early Tcm/Tem | 8 |
| 4 | ILTCK | GNLY+ Temra | 182 |
| 5 | ILTCK | GZMK+ Tem | 43 |
| 6 | ILTCK | GZMK+ Tex | 5 |
| 7 | ILTCK | ITGAE+ Tex | 1 |
| 8 | ILTCK | ITGAE+ Trm | 14 |
| 9 | ILTCK | ITGB2+ Trm | 3 |
| 11 | ILTCK | MAIT | 172 |
| 12 | ILTCK | Tcm | 15 |
| 16 | ILTCK | ZNF683+ Teff | 2 |
Part4SharingInInflam&irAE
DataProcessing
clone_circ = clone_df_generate(adata_hiit_circ)
clone_tissue = clone_df_generate(adata_hiit_tissue_pre)
hiit_cross_id = [
## Healthy
    "C16",
    "C17",
    "C18",
    "C21",
    "C30",
    "C33",
## Tumor
    "GU0700",
    "GU0715",
    "GU0744",
    "NPC_SC_1802",
    "NPC_SC_1805",
    "NPC_SC_1806",
    "NPC_SC_1807",
    "NPC_SC_1808",
    "NPC_SC_1810",
    "NPC_SC_1811",
    "NPC_SC_1813",
    "NPC_SC_1815",
    "NPC_SC_1816",
    'GC06',
    'GC07',
    'GC08',
    'GC10',
    'B230093',
    'B230498',
    'B230723',
    'B231260',
    'B357818',
    'PT_1',
    'PT_2',
    'PT_3',
    'PT_4',
    'PT_5',
    'PT_6',
    'PT_7',
    'PT_8',
## Inflam
    "U34",
    "U35",
    "U4",
    "U41",
    "U44",
    "U45",
    "U5",
## irAE
    "irAE_40",
    "irAE_45",
    "irAE_56",
    "irAE_62",
    "irAE_63",
    "irAE_65",
    "irAE_7",
    "irAE_76",
]
adata_hiit_cross = adata_hiit[adata_hiit.obs['individual_id'].isin(hiit_cross_id)]
clone_circ_cross = clone_circ[(clone_circ['individual_id'].isin(hiit_cross_id))].copy()
clone_tissue_cross = clone_tissue[(clone_tissue['individual_id'].isin(hiit_cross_id))].copy()

clone_hiit_cross = pd.merge(clone_circ_cross, clone_tissue_cross, on='cc_aa_identity')
clone_hiit_cross['total'] = clone_hiit_cross['total_x']+clone_hiit_cross['total_y']
clone_hiit_cross['all'] = 'all'
Counter(adata_hiit_cross.obs['study_name'])
Counter({'Shi_2022': 8263,
         'Sun_2022': 8982,
         'Liu_2022': 14265,
         'Boland_2020': 32990,
         'Liu_2021': 39360,
         'Borcherding_2021': 4563,
         'Kim_2022': 20507})
clone_merge_all_healthy = clone_hiit_cross[clone_hiit_cross['disease_type_x']=='Healthy']
clone_merge_all_inflam = clone_hiit_cross[clone_hiit_cross['disease_type_x']=='Inflammation']
clone_merge_all_irae = clone_hiit_cross[clone_hiit_cross['disease_type_x']=='irAE_inflammation']
clone_merge_all_stumor = clone_hiit_cross[clone_hiit_cross['disease_type_x']=='Solid tumor']

clone_merge_all_inflam = clone_merge_all_inflam[(clone_merge_all_inflam['Circulating']>=1) &
                                                (clone_merge_all_inflam['Tissue']>=1)]
clone_merge_all_irae = clone_merge_all_irae[(clone_merge_all_irae['Circulating']>=1) &
                                                (clone_merge_all_irae['Tissue']>=1)]
clone_merge_all_stumor = clone_merge_all_stumor[(clone_merge_all_stumor['Circulating']>=1) &
                                                (clone_merge_all_stumor['TIL']>=1)]
TIL-circ-sharing
adata_hiit_cross_circ = adata_hiit_cross[(adata_hiit_cross.obs['meta_tissue_type_aggr']=='Circulating')]
adata_hiit_cross_tissue = adata_hiit_cross[(adata_hiit_cross.obs['meta_tissue_type_aggr']=='Tissue')]
adata_hiit_cross_til = adata_hiit_cross[(adata_hiit_cross.obs['meta_tissue_type_aggr']=='TIL')]
clone_id_subset = np.unique(clone_merge_all_stumor.index)

adata_share_stumor = adata_hiit_cross_til[
    adata_hiit_cross_til.obs['cc_aa_identity'].isin(clone_id_subset)]

adata_share_stumor_reverse = adata_hiit_cross_til[
    (~adata_hiit_cross_til.obs.index.isin(adata_share_stumor.obs.index))
]

adata_hiit_cross_til.obs['circulating']=None
adata_hiit_cross_til.obs.loc[adata_share_stumor.obs.index, 'circulating'] = 'Sharing'
adata_hiit_cross_til.obs.loc[adata_hiit_cross_til.obs['circulating'].isna(), 'circulating'] = 'NoSharing'
fig,ax = plt.subplots(figsize=(5,5))
sc.pl.umap(adata_hiit_cross_til, color='circulating', palette=['#37c2ed','#ff8fbd'],
          ax=ax)
fig.savefig('figures/NA_sharing.png', dpi=600)
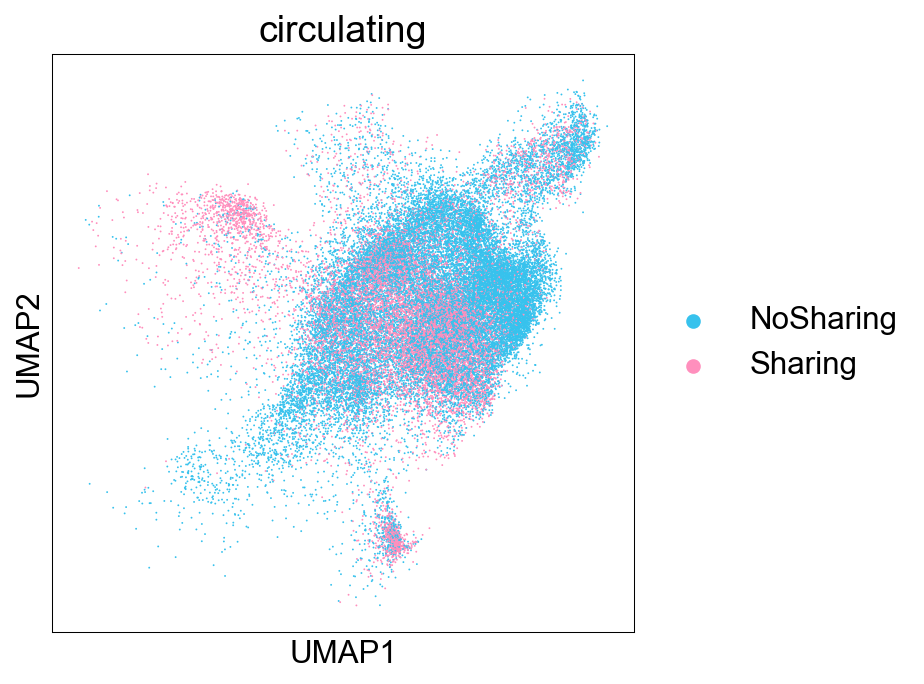
adata_til_cross_allg = adata_gene[adata_gene.obs.index.isin(adata_hiit_cross_til.obs.index)]
adata_til_cross_allg.obs = adata_hiit_cross_til.obs.copy()
adata_til_cross_allg.uns['log1p']['base'] = None
adata_til_cross_allg
AnnData object with n_obs × n_vars = 37429 × 19957
    obs: 'sample_name', 'study_name', 'label_1', 'label_2', 'label_3', 'label_4', 'atlas_name', 'leiden', 'class', 'reanno', 'cell_subtype', 'leiden_n_neighbors_30_reoslution_0.6', 'leiden_n_neighbors_30_reoslution_0.8', 'leiden_n_neighbors_30_reoslution_1.0', 'leiden_n_neighbors_30_reoslution_1.2', 'leiden_n_neighbors_50_reoslution_0.6', 'leiden_n_neighbors_50_reoslution_0.8', 'leiden_n_neighbors_50_reoslution_1.0', 'leiden_n_neighbors_50_reoslution_1.2', 'leiden_n_neighbors_15_reoslution_0.6', 'leiden_n_neighbors_15_reoslution_0.8', 'leiden_n_neighbors_15_reoslution_1.0', 'leiden_n_neighbors_15_reoslution_1.2', 'leiden_n_neighbors_40_reoslution_0.6', 'leiden_n_neighbors_40_reoslution_0.8', 'leiden_n_neighbors_40_reoslution_1.0', 'leiden_n_neighbors_40_reoslution_1.2', 'cell_subtype_revision', 'predictions', 'IR_VJ_1_junction_aa', 'IR_VDJ_1_junction_aa', 'IR_VJ_1_v_call', 'IR_VJ_1_j_call', 'IR_VDJ_1_v_call', 'IR_VDJ_1_j_call', 'disease', 'disease_type', 'disease_status', 'tissue_type', 'meta_tissue_type', 'individual_id', 'cell_subset', 'COVID19_status', 'treatment', 'treatment_status', 'donor_sex', 'donor_age', 'A_1', 'A_2', 'B_1', 'B_2', 'C_1', 'C_2', 'meta_cell_subset', 'cell_subtype2', 'meta_cell_subtype', 'tcr', 'cc_aa_identity', 'meta_tissue_type_aggr', 'cell_subtype_3', 'treatment_status_detail', 'cc_aa_identity_size', 'expansion_level', 'expansion_size', 'D50_cc_aa_identity', 'clone_umap', 'circulating'
    uns: 'log1p'
    obsm: 'X_gex', 'X_umap'
sc.tl.rank_genes_groups(adata_til_cross_allg, groupby='circulating',
                        groups=['Sharing'], reference='NoSharing')
WARNING: Default of the method has been changed to 't-test' from 't-test_overestim_var'
fig,ax=ScanpyVolcanoPlot(
    adata_til_cross_allg, axis=0,
    label_fold_change=0.25, label_log_p=2,
    label_size=6 ,
    label_excludes=list(adata_til_cross_allg.var.index),
    label_includes=[
        'CCL5',
        'CCL4',
        'CCL4L2',
        'KLRK1',
        'KLRD1',
        'KLRG1',
        'ANXA1',
        'CD52',
        #control
        'CXCL13',
        'ENTPD1',
        'HAVCR2',
        'TOX',
        'PDCD1',
    ],
    color2='#ff8fbd',
    color1='#2cbef7',
    size_by='circulating',
    size_group='Sharing',
    size_reference='NoSharing'
)
fig.set_size_inches((4,4))
fig.savefig('figures/NNB1_sharing_volcano.pdf')
Fraction of gene CCL5 is 0.9923615531508593
Fraction of gene CCL4 is 0.7654360280076384
Fraction of gene CCL4L2 is 0.5196530872056015
Fraction of gene KLRK1 is 0.37643220878421385
Fraction of gene KLRD1 is 0.3232813494589433
Fraction of gene KLRG1 is 0.26965308720560155
Fraction of gene ANXA1 is 0.7740292807129217
Fraction of gene CD52 is 0.9147835773392744
Fraction of gene CXCL13 is 0.09540101845957989
Fraction of gene ENTPD1 is 0.0519573520050923
Fraction of gene HAVCR2 is 0.09778803309993635
Fraction of gene TOX is 0.160964353914704
Fraction of gene PDCD1 is 0.1558720560152769
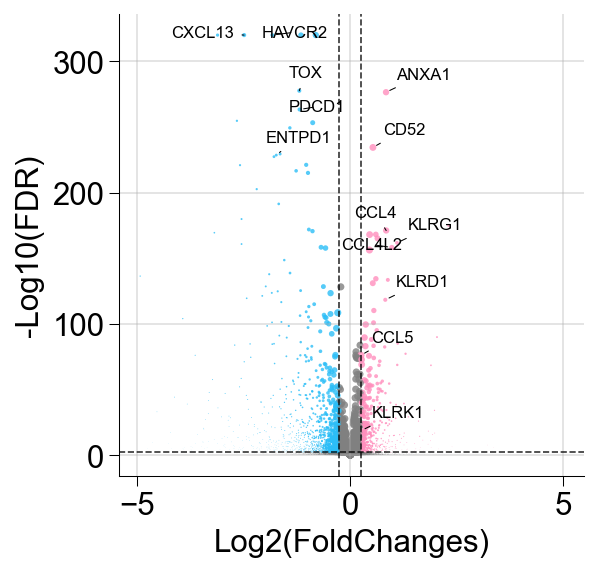
fig,ax=plt.subplots(figsize=(5,5))
sc.pl.umap(adata_hiit_cross_til, color='CXCL13', size=5, cmap='Reds', ax=ax,)
fig.savefig('figures/sharing_CXCL13.png', dpi=600)

fig,ax=plt.subplots(figsize=(5,5))
sc.pl.violin(adata_hiit_cross_til, keys='CXCL13', ax=ax,
             groupby='circulating', stripplot=False)
fig.savefig('figures/sharing_CXCL13_violin.pdf')


fig,ax=plt.subplots(figsize=(5,5))
sc.pl.umap(adata_hiit_cross_til, color='ENTPD1', size=5, cmap='Reds', ax=ax,)
fig.savefig('figures/sharing_ENTPD1.png', dpi=600)

fig,ax=plt.subplots(figsize=(5,5))
sc.pl.violin(adata_hiit_cross_til, keys='ENTPD1', ax=ax,
             groupby='circulating', stripplot=False)
fig.savefig('figures/sharing_ENTPD1_violin.png')
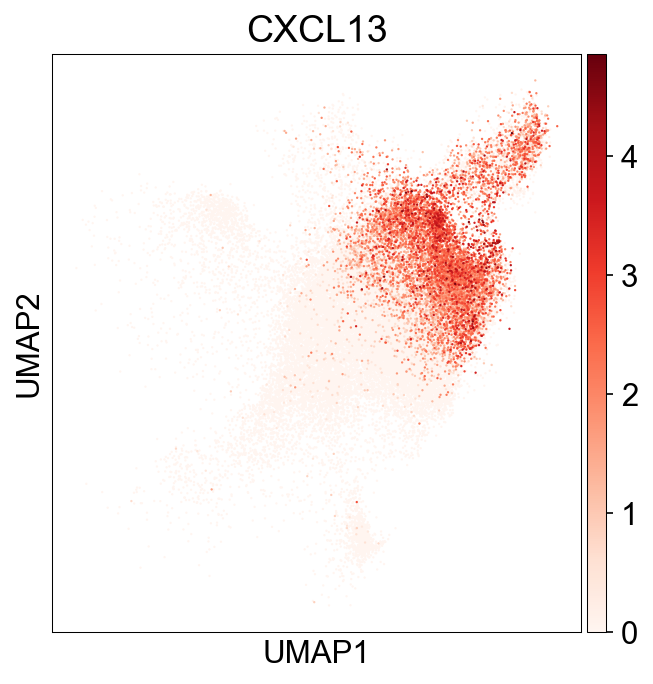
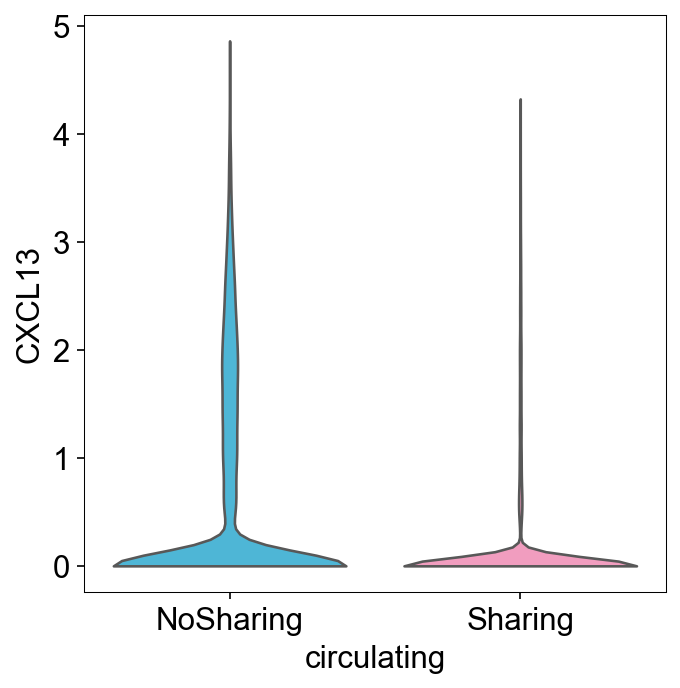
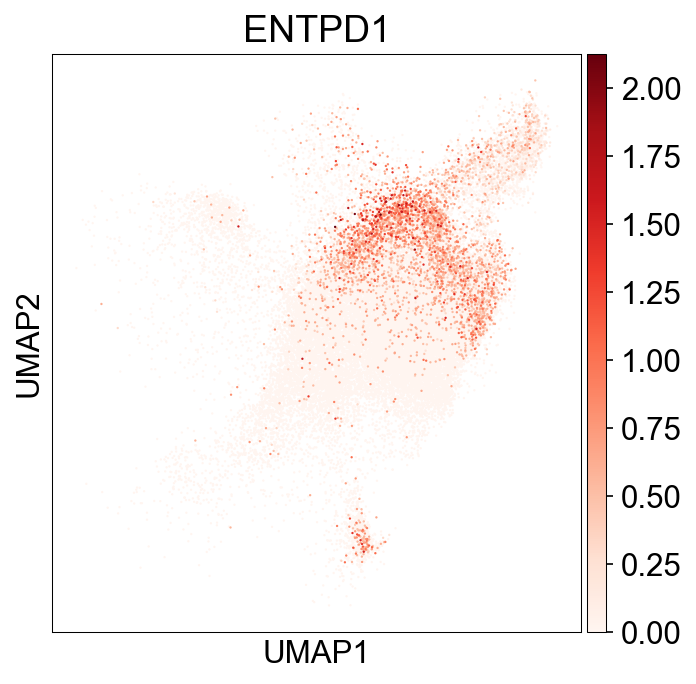
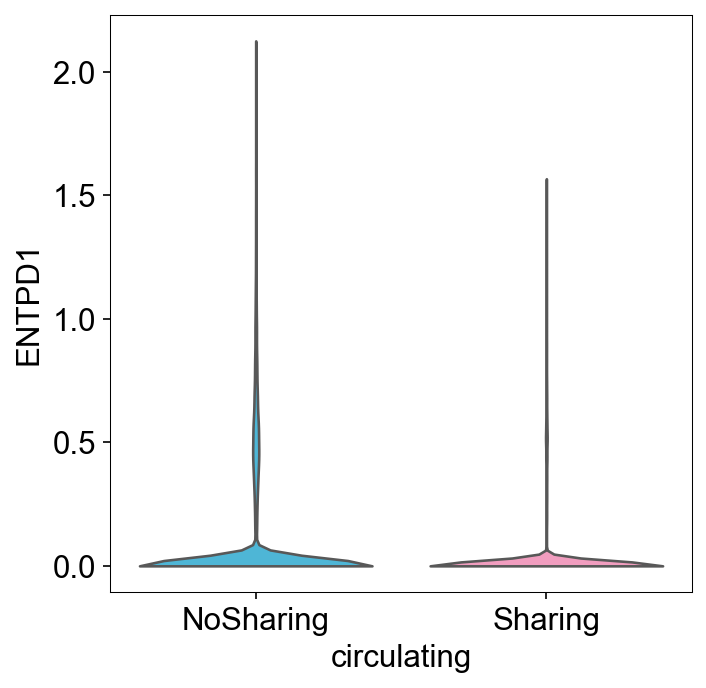
SCENIC analysis
Many codes from the scenic analysis part are based on the SCENIC tutorial (https://github.com/aertslab/SCENICprotocol/blob/master/notebooks/SCENIC Protocol - Case study - Cancer data sets.ipynb)
Reference datasets from the cisTarget database are available at https://resources.aertslab.org/cistarget/databases/.
Transcription factors list is available at https://github.com/aertslab/pySCENIC/
import os, glob, re, pickle
from functools import partial
from collections import OrderedDict
import operator as op
from cytoolz import compose

import pandas as pd
import seaborn as sns
import numpy as np
import scanpy as sc
import anndata as ad
import matplotlib as mpl
import matplotlib.pyplot as plt

from pyscenic.export import export2loom, add_scenic_metadata
from pyscenic.utils import load_motifs
from pyscenic.transform import df2regulons
from pyscenic.aucell import aucell
from pyscenic.binarization import binarize
from pyscenic.rss import regulon_specificity_scores
from pyscenic.plotting import plot_binarization, plot_rss

from IPython.display import HTML, display

# Downloaded fromm pySCENIC github repo: https://github.com/aertslab/pySCENIC/tree/master/resources
HUMAN_TFS_FNAME = os.path.join(RESOURCES_FOLDERNAME, 'lambert2018.txt')
# Ranking databases. Downloaded from cisTargetDB: https://resources.aertslab.org/cistarget/
RANKING_DBS_FNAMES = ['./data/hg38__refseq-r80__500bp_up_and_100bp_down_tss.mc9nr.genes_vs_motifs.rankings.feather']
# Motif annotations. Downloaded from cisTargetDB: https://resources.aertslab.org/cistarget/
MOTIF_ANNOTATIONS_FNAME = os.path.join(AUXILLIARIES_FOLDERNAME, './data/motifs-v9-nr.hgnc-m0.001-o0.0.tbl')
def derive_regulons(motifs, db_names=('hg38__refseq-r80__500bp_up_and_100bp_down_tss.mc9nr.genes_vs_motifs.rankings')):
    # motifs.columns = motifs.columns.droplevel(0)

    def contains(*elems):
        def f(context):
            return any(elem in context for elem in elems)
        return f

    # For the creation of regulons we only keep the 10-species databases and the activating modules. We also remove the
    # enriched motifs for the modules that were created using the method 'weight>50.0%' (because these modules are not part
    # of the default settings of modules_from_adjacencies anymore.
    motifs = motifs[
        np.fromiter(map(compose(op.not_, contains('weight>50.0%')), motifs.Context), dtype=bool) & \
        # np.fromiter(map(contains(*db_names), motifs.Context), dtype=np.bool) & \
        np.fromiter(map(contains('activating'), motifs.Context), dtype=bool)
    ]

    # We build regulons only using enriched motifs with a NES of 3.0 or higher; we take only directly annotated TFs or TF annotated
    # for an orthologous gene into account; and we only keep regulons with at least 10 genes.
    regulons = list(filter(lambda r: len(r) >= 10, df2regulons(motifs[
        (motifs['NES'] >= 1.0)

        & ((motifs['Annotation'] == 'gene is directly annotated')
        | (motifs['Annotation'].str.startswith('gene is orthologous to')
        & motifs['Annotation'].str.endswith('which is directly annotated for motif')))
    ])))

    # Rename regulons, i.e. remove suffix.
    return list(map(lambda r: r.rename(r.transcription_factor), regulons))
SCENIC for irAE analysis
adata_irae_all = sc.read_h5ad('/Volumes/rsch/GEXnotebook/source/adata_irae.h5ad')
adata_subset_irae_all = adata_all_genes[adata_irae_all.obs.index]
EXP_MTX_QC_FNAME = "./data/huARdb_v2_GEX.CD8.all_genes.subset.scenic_qc.irae_all.csv"
df_exp = adata_subset_irae_all.to_df()
df_exp.to_csv(EXP_MTX_QC_FNAME)
!pyscenic \
grn ./huARdb_v2_GEX.CD8.all_genes.subset.scenic_qc.irae_all.csv \
./data/lambert2018.txt \
-o ./data/pyscenic_adjacencies.irae_all.tsv \
--num_workers 64
!pyscenic ctx ./data/pyscenic_adjacencies.tex_major.tsv \
            ./data/hg19-500bp-upstream-10species.mc9nr.genes_vs_motifs.rankings.feather \
            ./data/hg19-tss-centered-10kb-10species.mc9nr.genes_vs_motifs.rankings.feather \
            ./data/hg19-tss-centered-5kb-10species.mc9nr.genes_vs_motifs.rankings.feather \
            --annotations_fname  ./data/motifs-v9-nr.hgnc-m0.001-o0.0.tbl \
            --expression_mtx_fname  ./data/huARdb_v2_GEX.CD8.all_genes.subset.scenic_qc.irae_all.csv \
            --output ./data/pyscenic_motifs.irae_all.csv \
            --num_workers 64
df_motifs = load_motifs('./data/pyscenic_motifs.irae_all.csv')
regulons = derive_regulons(df_motifs)
# Pickle these regulons.
REGULONS_DAT_FNAME = './data/pyscenic_regulons.irae_all.dat'
with open(REGULONS_DAT_FNAME, 'wb') as f:
    pickle.dump(regulons, f)
AUCELL_MTX_FNAME = './data/pyscenic_auc.irae_all.csv'
auc_mtx = aucell(df_exp, regulons, num_workers=64)
auc_mtx.to_csv(AUCELL_MTX_FNAME)
add_scenic_metadata(adata_subset_irae_all, auc_mtx, regulons)
df_obs = adata_subset.obs
signature_column_names = list(df_obs.select_dtypes('number').columns)
signature_column_names = list(filter(lambda s: s.startswith('Regulon('), signature_column_names))

df_scores = df_obs.loc[df_obs['cell_subtype_3'].isin(['GZMK+ Tex','ITGAE+ Tex']),
                       signature_column_names + ['cell_subtype_3']]
df_results = ((df_scores.groupby(by='cell_subtype_3').mean() - df_obs[signature_column_names].mean())/ df_obs[signature_column_names].std()).stack().reset_index().rename(columns={'level_1': 'regulon', 0:'Z'})
df_results['regulon'] = list(map(lambda s: s[8:-1], df_results.regulon))
df_results[(df_results.Z >= 0)].sort_values('Z', ascending=False).head()


df_heatmap = pd.pivot_table(data=df_results[df_results.Z >= 0.5].sort_values('Z', ascending=False),
                           index='cell_subtype_3', columns='regulon', values='Z')
#df_heatmap.drop(index='Myocyte', inplace=True) # We leave out Myocyte because many TFs are highly enriched (becuase of small number of cells).
cm = sns.clustermap(df_heatmap.fillna(0), fmt=".1f", linewidths=.7,
            cbar=False, linecolor='gray',  yticklabels=True,  xticklabels=True,
            cmap="YlGnBu", annot_kws={"size": 12})
cm.fig.set_size_inches(9,1)
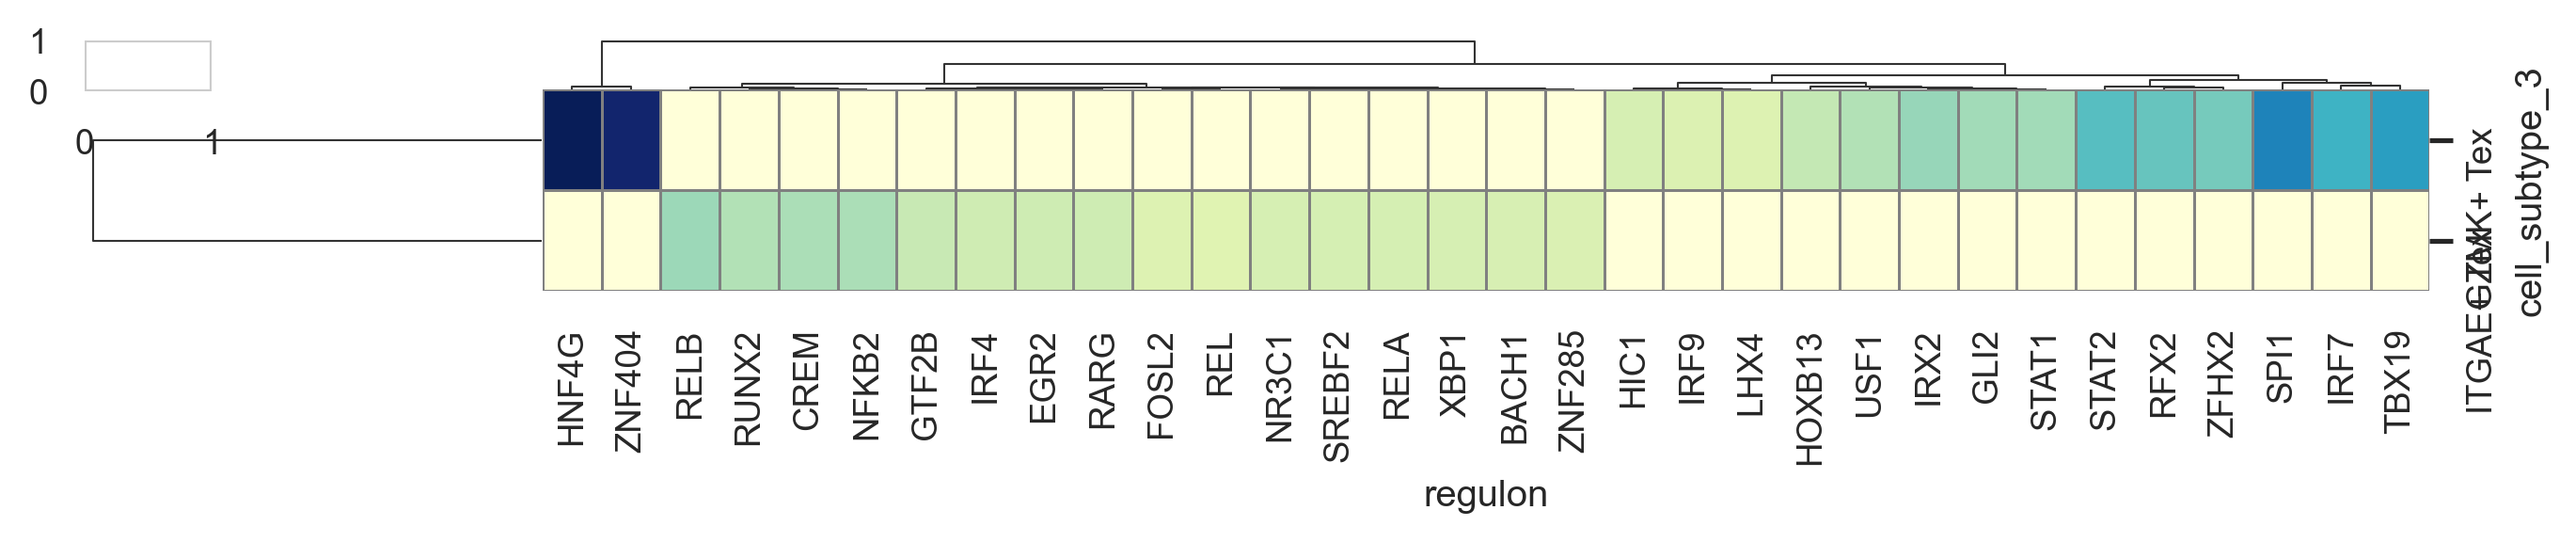
SCENIC for Tex subset analysis
adata_tex = sc.read_h5ad("/Users/snow/Desktop/2023-NM-Revision-GEX-HuARdb-Notebooks/data/20231210Tex.retrain_vae.h5ad")
adata_subset_tex = adata_all_genes[adata_tex.obs.index]
EXP_MTX_QC_FNAME = "./data/huARdb_v2_GEX.CD8.all_genes.subset.scenic_qc.tex.csv"
df_exp = adata_subset_tex.to_df()
df_exp.to_csv(EXP_MTX_QC_FNAME)
!pyscenic \
grn ./huARdb_v2_GEX.CD8.all_genes.subset.scenic_qc.tex.csv \
./data/lambert2018.txt \
-o ./data/pyscenic_adjacencies.tex.tsv \
--num_workers 64
!pyscenic ctx ./data/pyscenic_adjacencies.tex_major.tsv \
            ./data/hg19-500bp-upstream-10species.mc9nr.genes_vs_motifs.rankings.feather \
            ./data/hg19-tss-centered-10kb-10species.mc9nr.genes_vs_motifs.rankings.feather \
            ./data/hg19-tss-centered-5kb-10species.mc9nr.genes_vs_motifs.rankings.feather \
            --annotations_fname  ./data/motifs-v9-nr.hgnc-m0.001-o0.0.tbl \
            --expression_mtx_fname  ./data/huARdb_v2_GEX.CD8.all_genes.subset.scenic_qc.tex.csv \
            --output ./data/pyscenic_motifs.tex.csv \
            --num_workers 64
df_motifs = load_motifs('./data/pyscenic_motifs.tex.csv')
regulons = derive_regulons(df_motifs)
# Pickle these regulons.
REGULONS_DAT_FNAME = './data/pyscenic_regulons.tex.dat'
with open(REGULONS_DAT_FNAME, 'wb') as f:
    pickle.dump(regulons, f)
AUCELL_MTX_FNAME = './data/pyscenic_auc.tex.csv'
auc_mtx = aucell(df_exp, regulons, num_workers=64)
auc_mtx.to_csv(AUCELL_MTX_FNAME)
add_scenic_metadata(adata_subset_tex, auc_mtx, regulons)
df_heatmap = pd.pivot_table(data=df_results[df_results.Z >= 0.25].sort_values('Z', ascending=False),
                           index='cell_subtype_4', columns='regulon', values='Z')
#df_heatmap.drop(index='Myocyte', inplace=True) # We leave out Myocyte because many TFs are highly enriched (becuase of small number of cells).
cm = sns.clustermap(df_heatmap.fillna(0), fmt=".1f", linewidths=.7,
            cbar=False, linecolor='gray',  xticklabels=True,
            cmap="YlGnBu", annot_kws={"size": 12})
cm.fig.set_size_inches(28,2)
# fig.yticks(rotation=90)
cm.fig.savefig("./figures/PyScenic_TEX_enrichment.pdf")
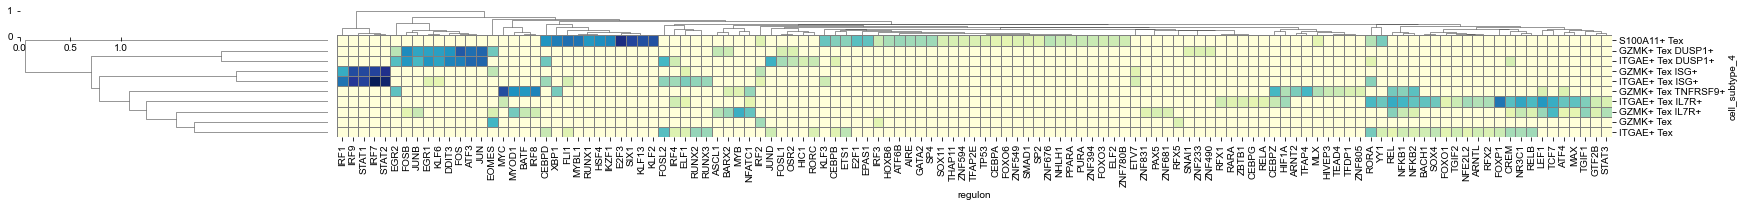
selecting TF-genes for regulatory network
node_edge_dict = {'nodes':[],'links':[]}
snode = set()
df_heatmap = df_results[np.array(df_results.Z >= 0)].sort_values('Z', ascending=False).head(32)
s = set(df_heatmap['regulon'])
for i in list(filter(lambda x: x.name in s, regulons)):
    tf = i.name
    if all(map(lambda x: x < 0, i.gene2weight.values())):
        continue
    node_edge_dict['nodes'].append(dict(
        id=tf,
        group='TF'
    ))
    snode.add(tf)
    for j,w in i.gene2weight.items():
        if w >= 5:
            if j not in snode:
                node_edge_dict['nodes'].append(dict(
                    id=j,
                    group='G'
                ))
                snode.add(j)
            node_edge_dict['links'].append(dict(
                source=tf,
                target=j,
                value=w
            ))

### node_edge_dict is used for visualization the network